Visualizing Results (deprecated)
There are multiple ways to consume and understand the search results: row view, data summary view, and graph view.
Row View
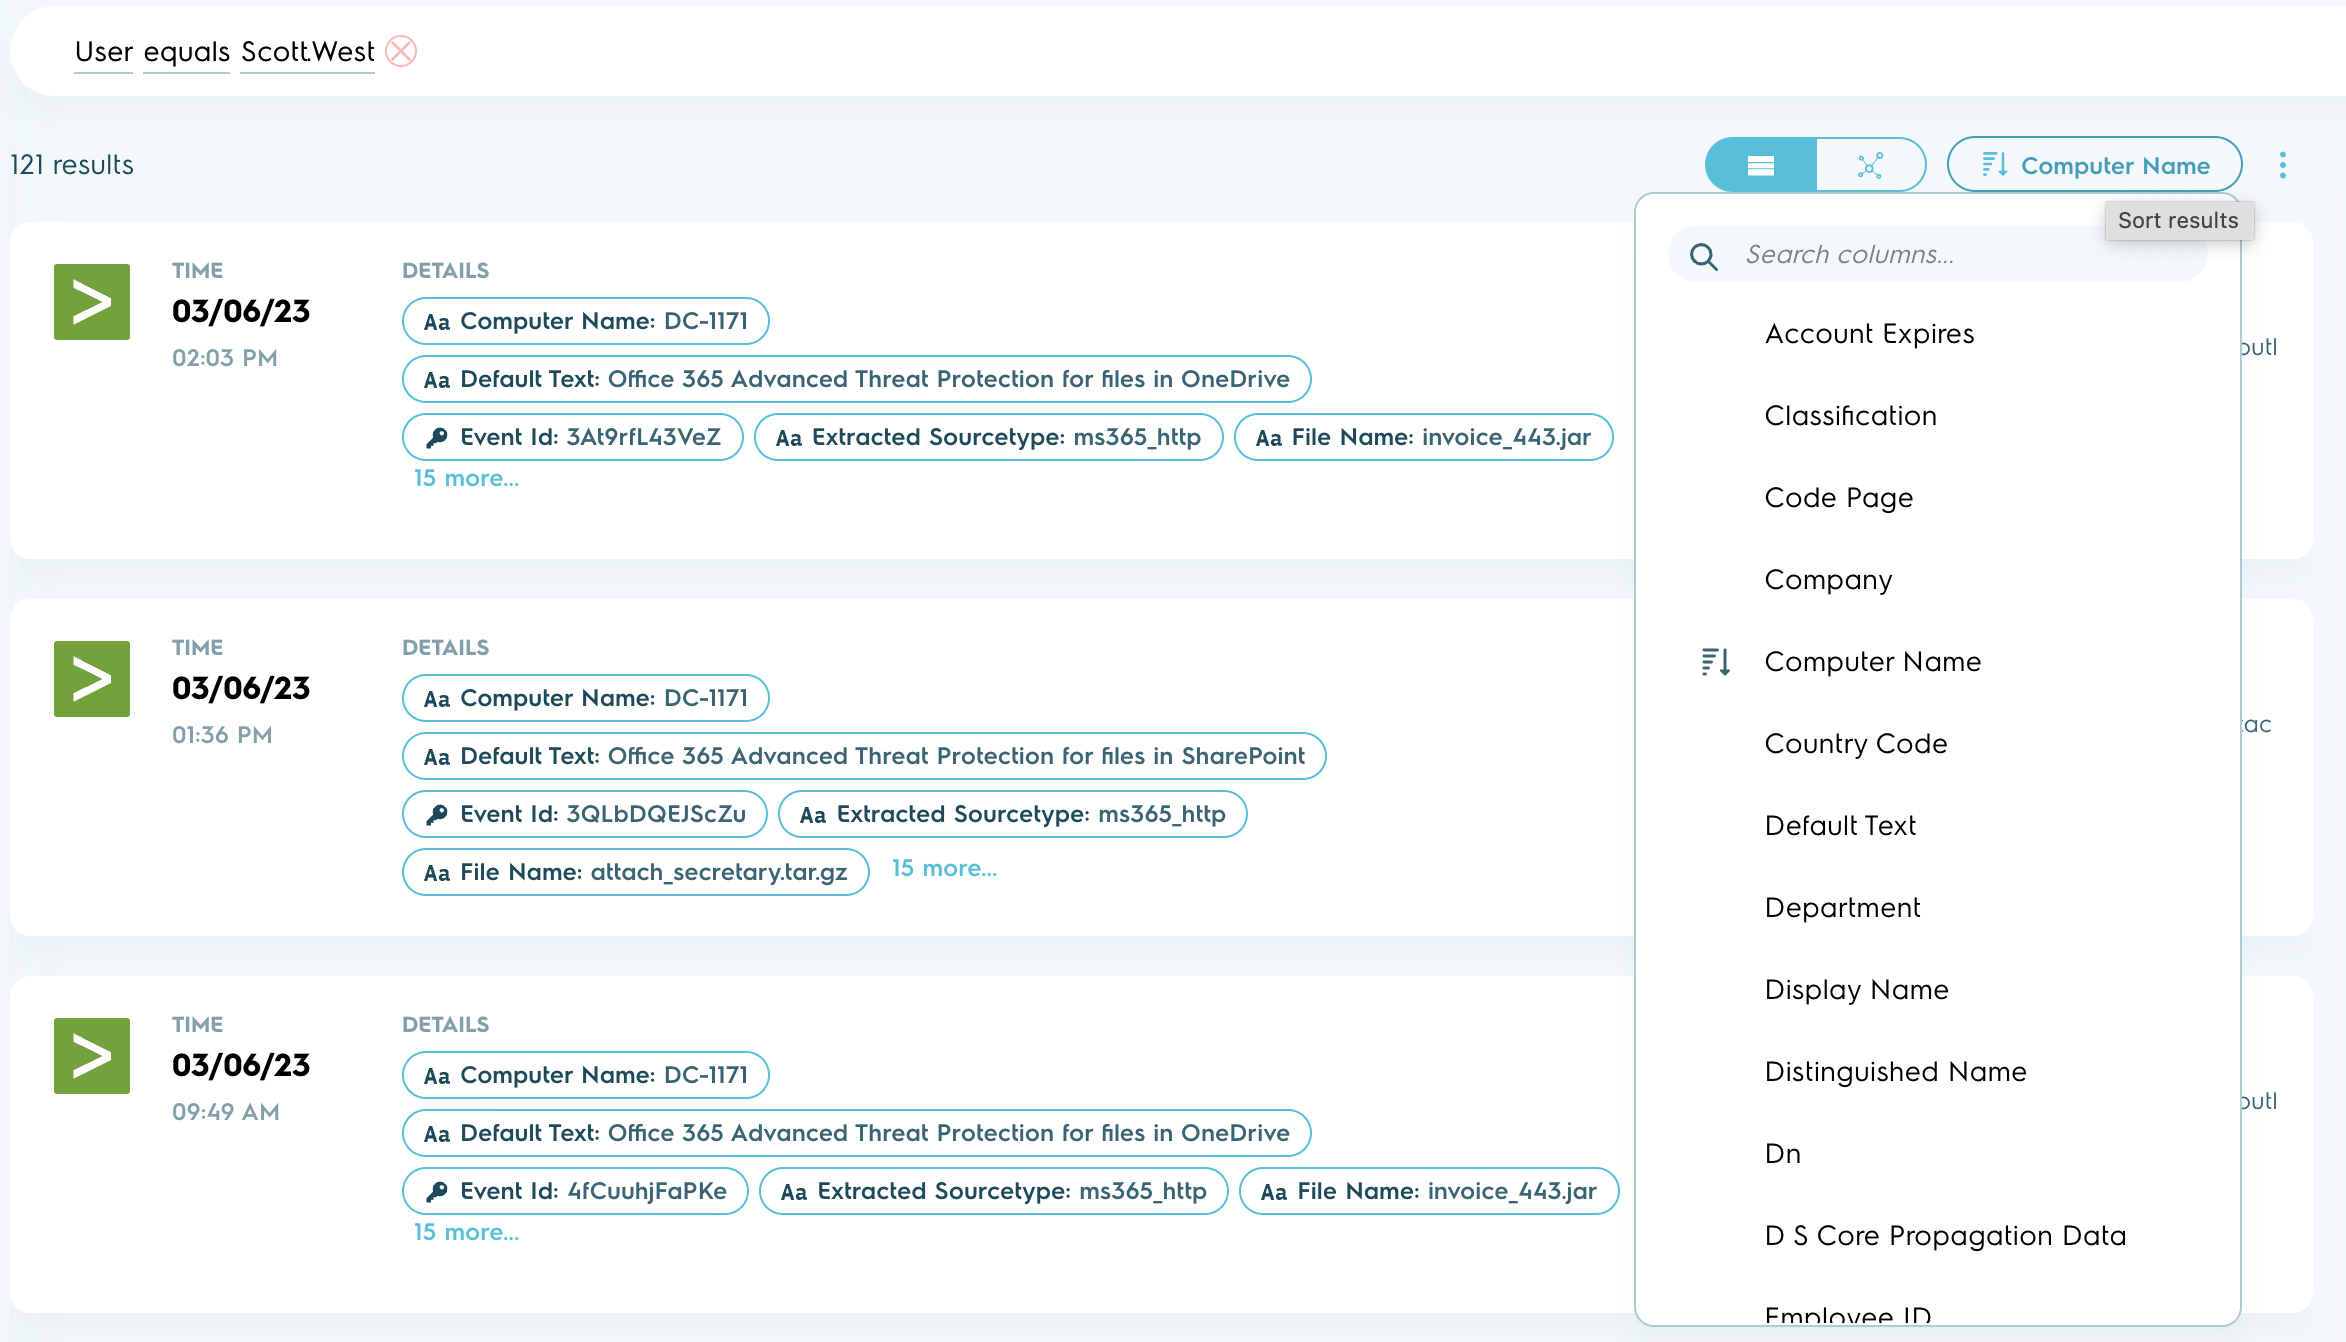
Row view is the default view, with individual search results as rows. You can scroll to the bottom and paginate through results. The results are reverse sorted by time, i.e. the most-recent result show up at the top. You can change the sort field or sort order from the menu item on the top right. The fields to sort on are data-driven, dynamically detected from the available results.
Federated Search Row View
Note: only a subset of results are transferred from the data sources for visualization. The maximum number of results to transfer is determined by cache settings and default to 1000 results per data source. Operations like sorting are performed on the cached set of results vs on the full source data.
Row Details and Entities
Each row shows some of the key data fields. Also, detected Entities like User, Host, IP, File, etc. are shown on the right.

Individual Search Result Row
Row Detail View
Click on any row to bring the row detail view to show all data for that row.
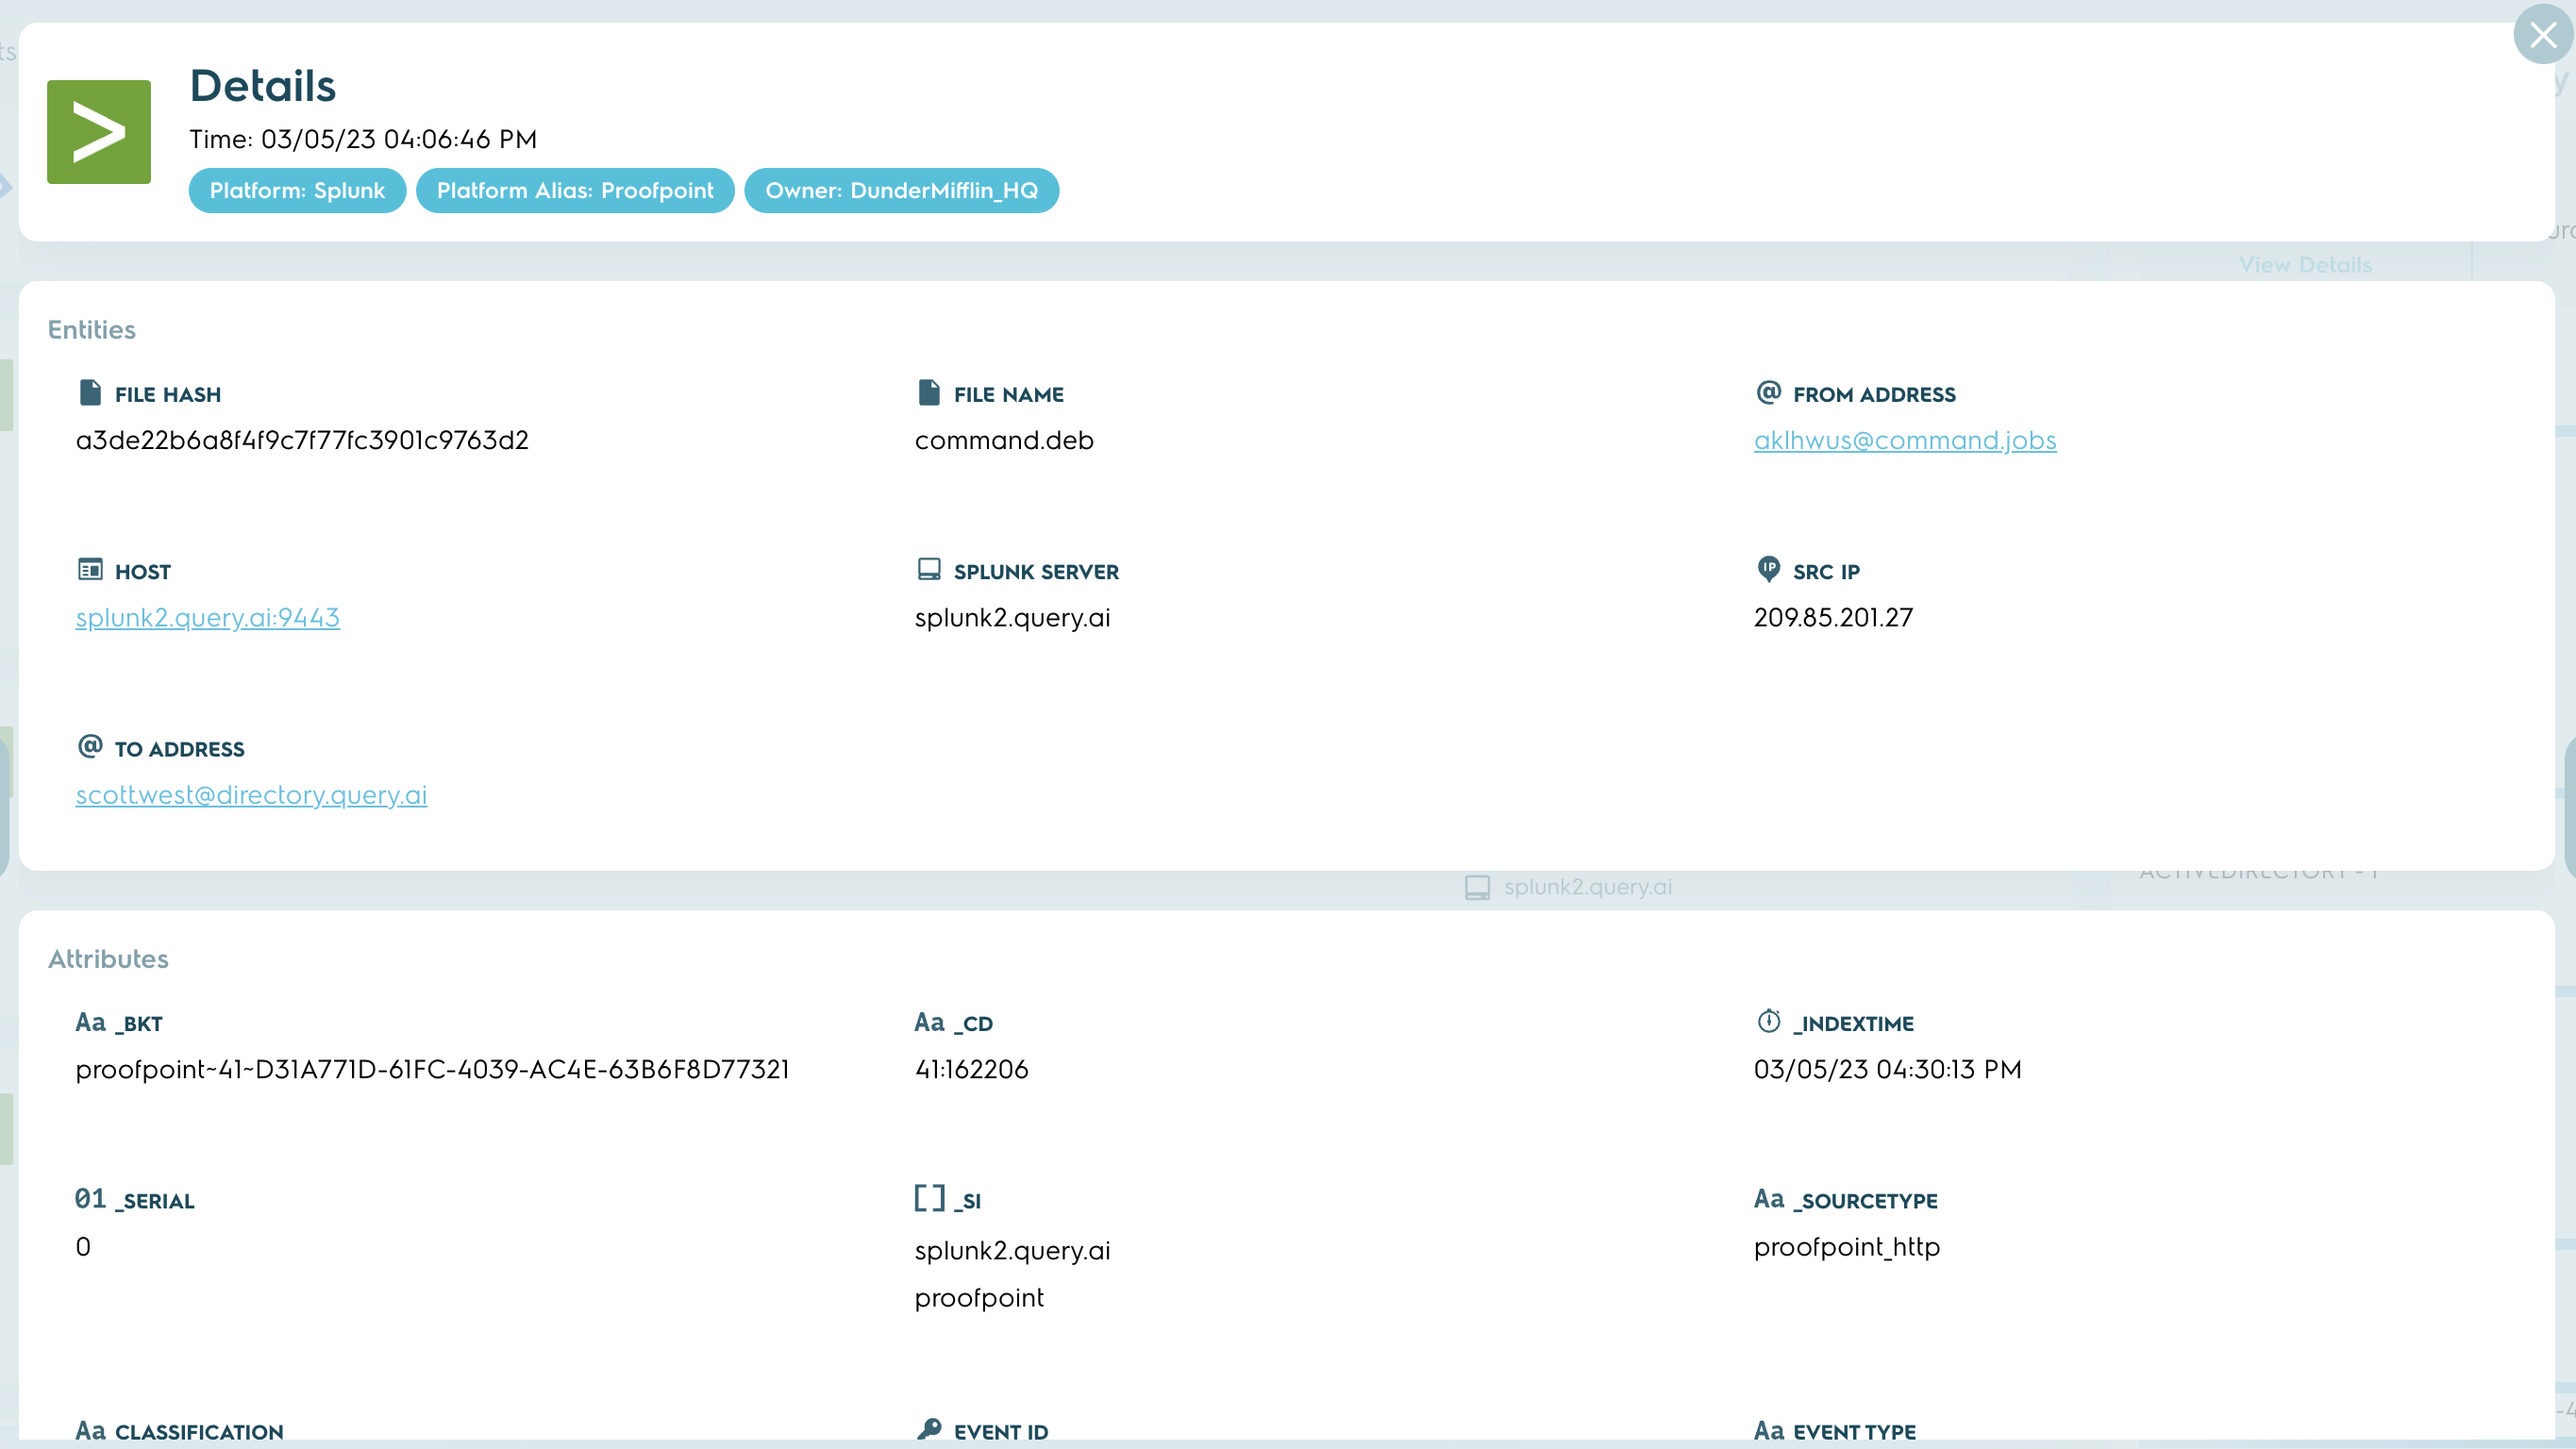
Row Detail View
Data Summary View
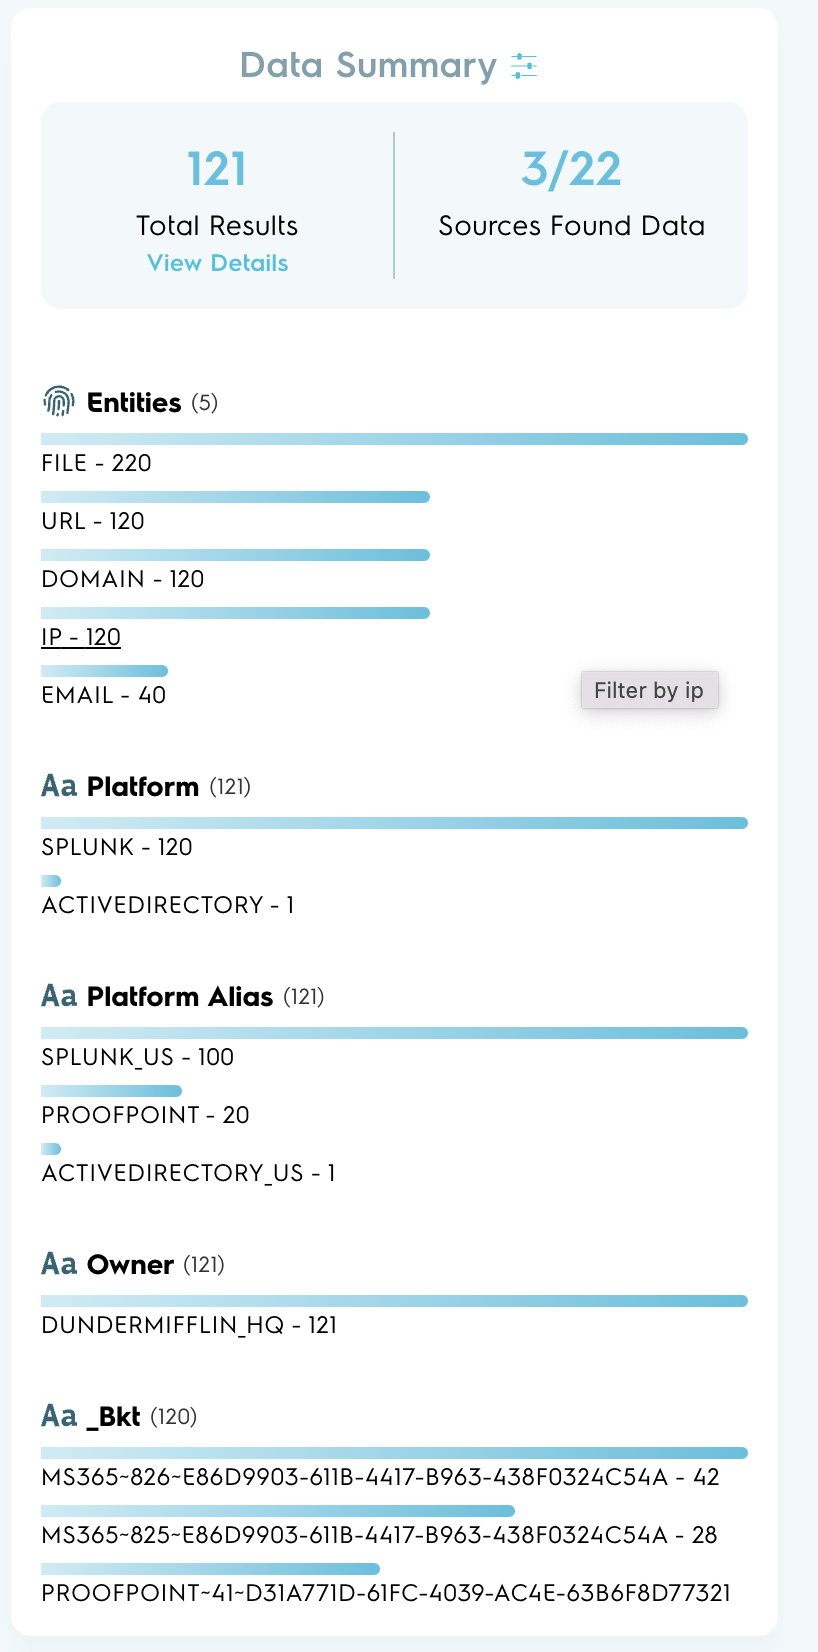
In the panel to the right of individual results, you will see a Data Summary view that gives faceted information on particular fields. This view will give you an idea of the frequency distribution of any field's values. Clicking on any value will filter the visible results to only show the rows that have that particular field-value.
Federated Search Data Summary View
Graph View
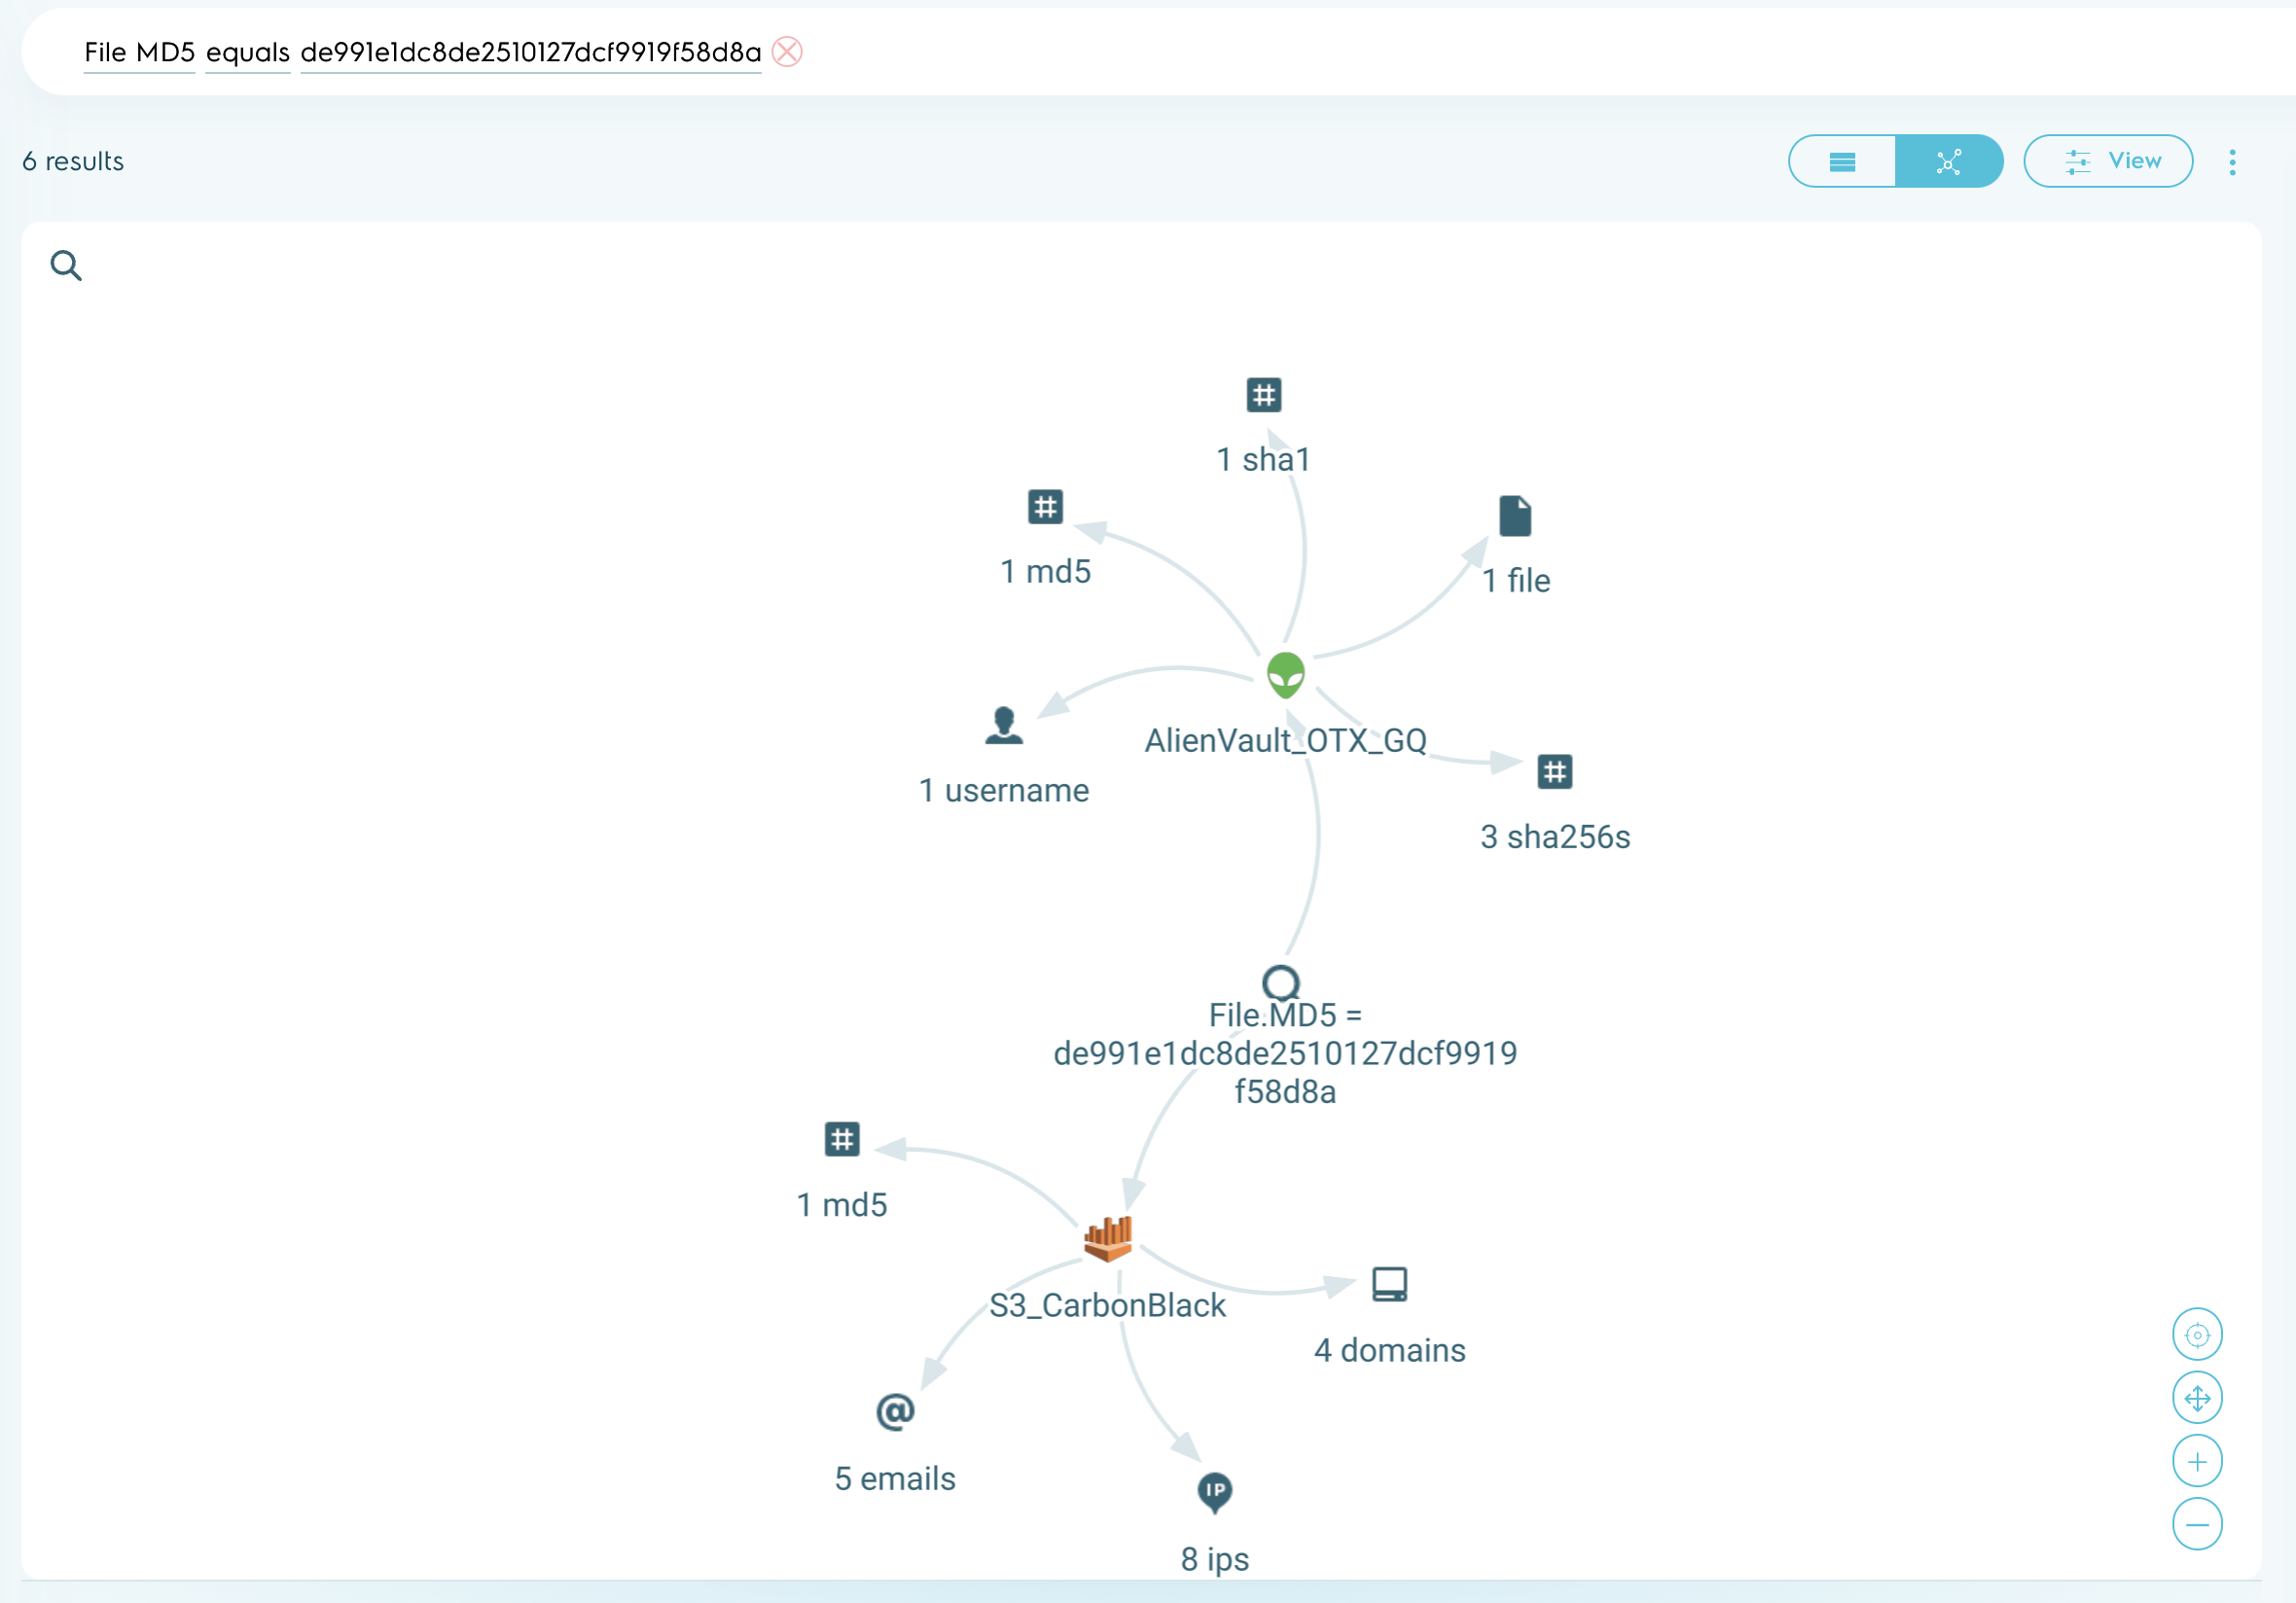
Instead of the Row View, you can select the Graph View option from the selector at the top-right. The Graph View will show a summary of relevant Entities and their relationships. Note: the graph nodes and counts are from the subset of search results transferred from the source platform vs the full matched source data.
Federated Search Graph View
On the bottom right corner of the graph, you will notice additional controls to zoom in/out, pan, and center the graph.
Clicking on any node will bring up additional contextual data. You can pivot your search based upon that information.
Updated 11 months ago