Searching in the Query UI
Learn how to navigate the Query Federated Search results grid
As of 15 SEPT 2024, Query released an upgraded version of the results grid that provides new ways to visualize, filter, and interact with your federated search results.
To start, first submit a search that will return data using the Federated Search Query Builder. Users can choose to search broadly by using Entities, which are mapped against scalar Open Cyber Security Format (OCSF) Observables (see more here), or by using Events which are mapped 1:1 with OCSF. Within Events, users can search for logs and findings mapped against an Event and optionally provide deep filters to search for specific attributes within an Event.
Results Grid Navigation
For this example, a search for a Process Name Entity cmd.exe is executed against a data lake platform containing synthetic Endpoint Detection & Response data as shown below (Fig. 1). The broader the search, and the more Selected Connectors enabled, the larger the search results.
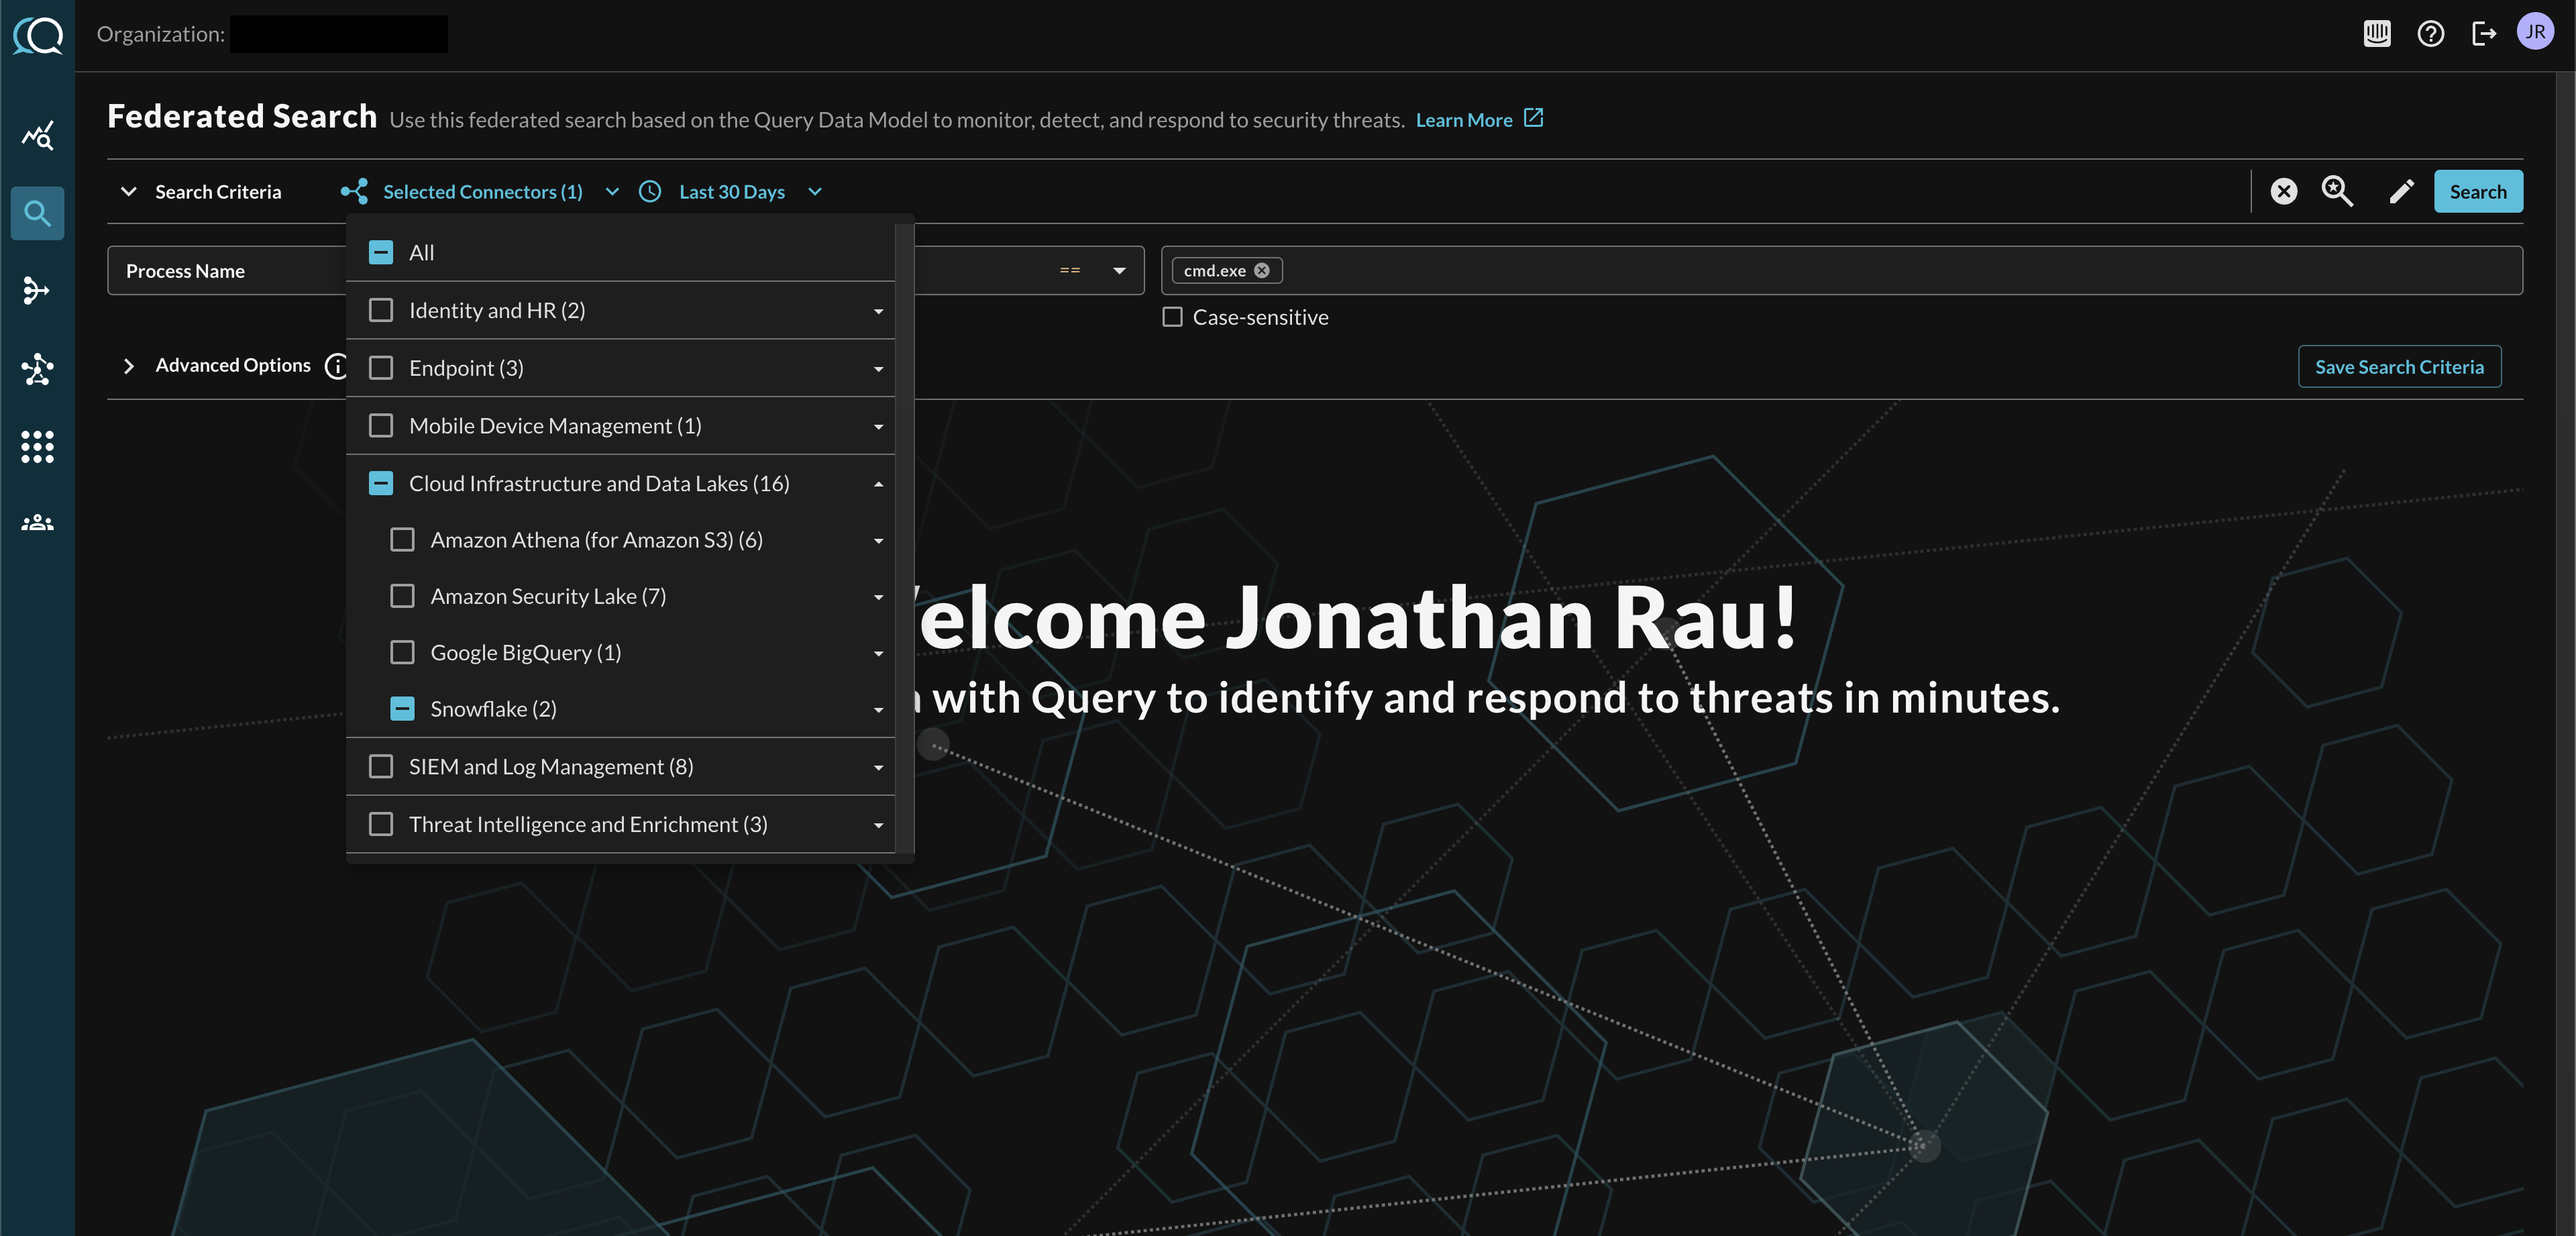
Fig. 1 - Performing a single value Process Name Entity-based search against a single platform
Upon your initial search, you will be presented with a loading state and duration until the first sets of results are returned from your Query, as shown below (Fig. 2). This time is variable and depends on the complexity of the query, query conditions, Selected Connector choices, and the downstream platforms. Query handles the translation of the search, planning of the query, returning, and re-normalization of the results into the Query Data Model (QDM, based on OCSF).

Fig. 2 - Waiting state shown before the first results are returned
After the first results are returned to the grid, the waiting state is moved to a smaller spinner at the top right of the screen, directly above the area chart visualization, and will persist until all results are returned, as shown below (Fig. 3).
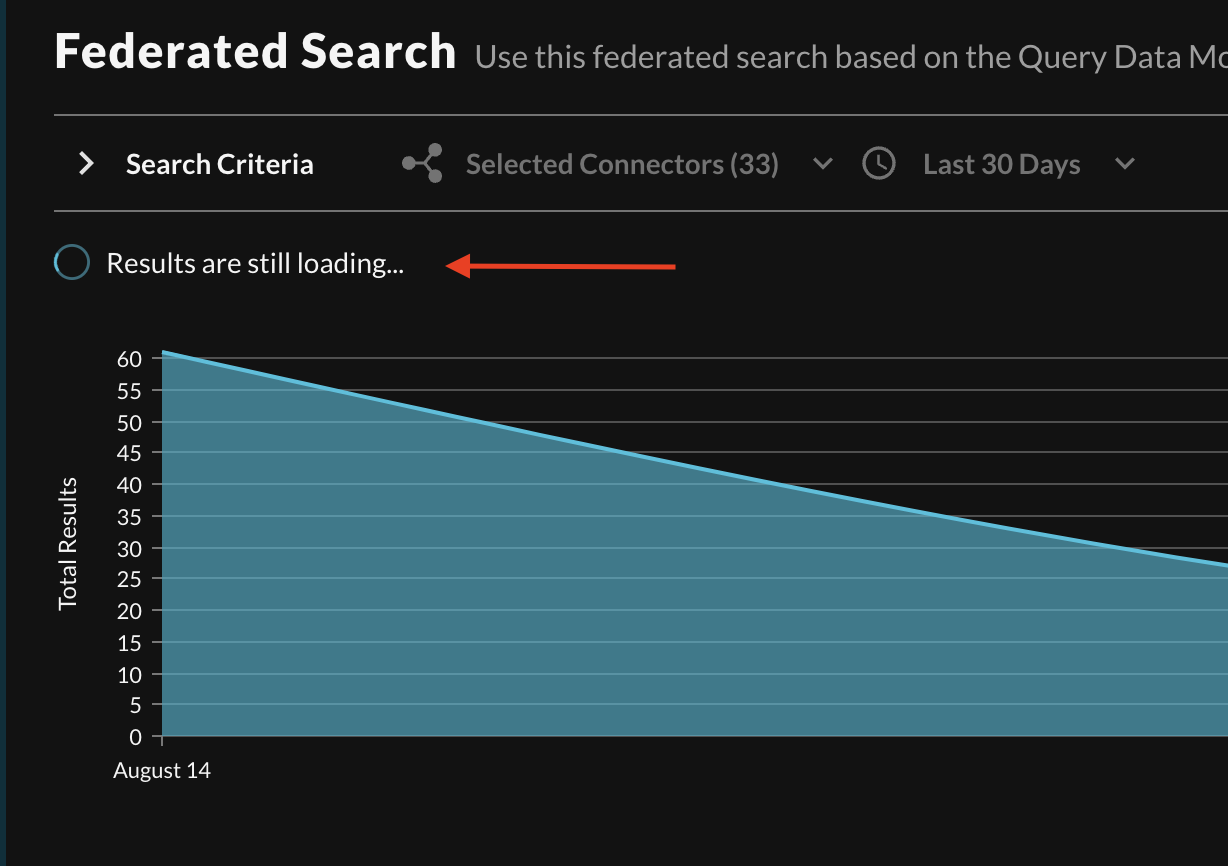
Fig. 3 - In-progress results waiting state spinner
Once the query Results are fulfilled for your search, any errors that were encountered are shown within an expandable banner element, as shown below (Fig. 4). The banner can also be dismissed with the X button and minimized as shown in Fig. 5.

Fig. 4 - Error results banner after returned results

Fig. 5 - Minimized error results
A little bit on errors...Errors can differ based on Connector issues with authentication and connectivity, but can also be transient errors when a specific Connector cannot fulfill a search due to not support a specific Entity, Event, or condition.
Errors both provide helpful user troubleshooting information and important metadata for extended troubleshooting, if required, with your Query Customer Success Manager or Technical Account Manager.
With a finalized result set returned to the grid (as shown below in Fig. 6) there are several areas of note to orient against, starting from the top of the results view the first element is a filled area chart that plots number of results on the Y-axis, and the normalized time period on the X-Axis. There is an expandable Filters section that provides filters of the columns in the results grid, the time range, and result-specific dynamic filters based on the data returned. Finally, the grid itself presents default columns that are movable and sortable.
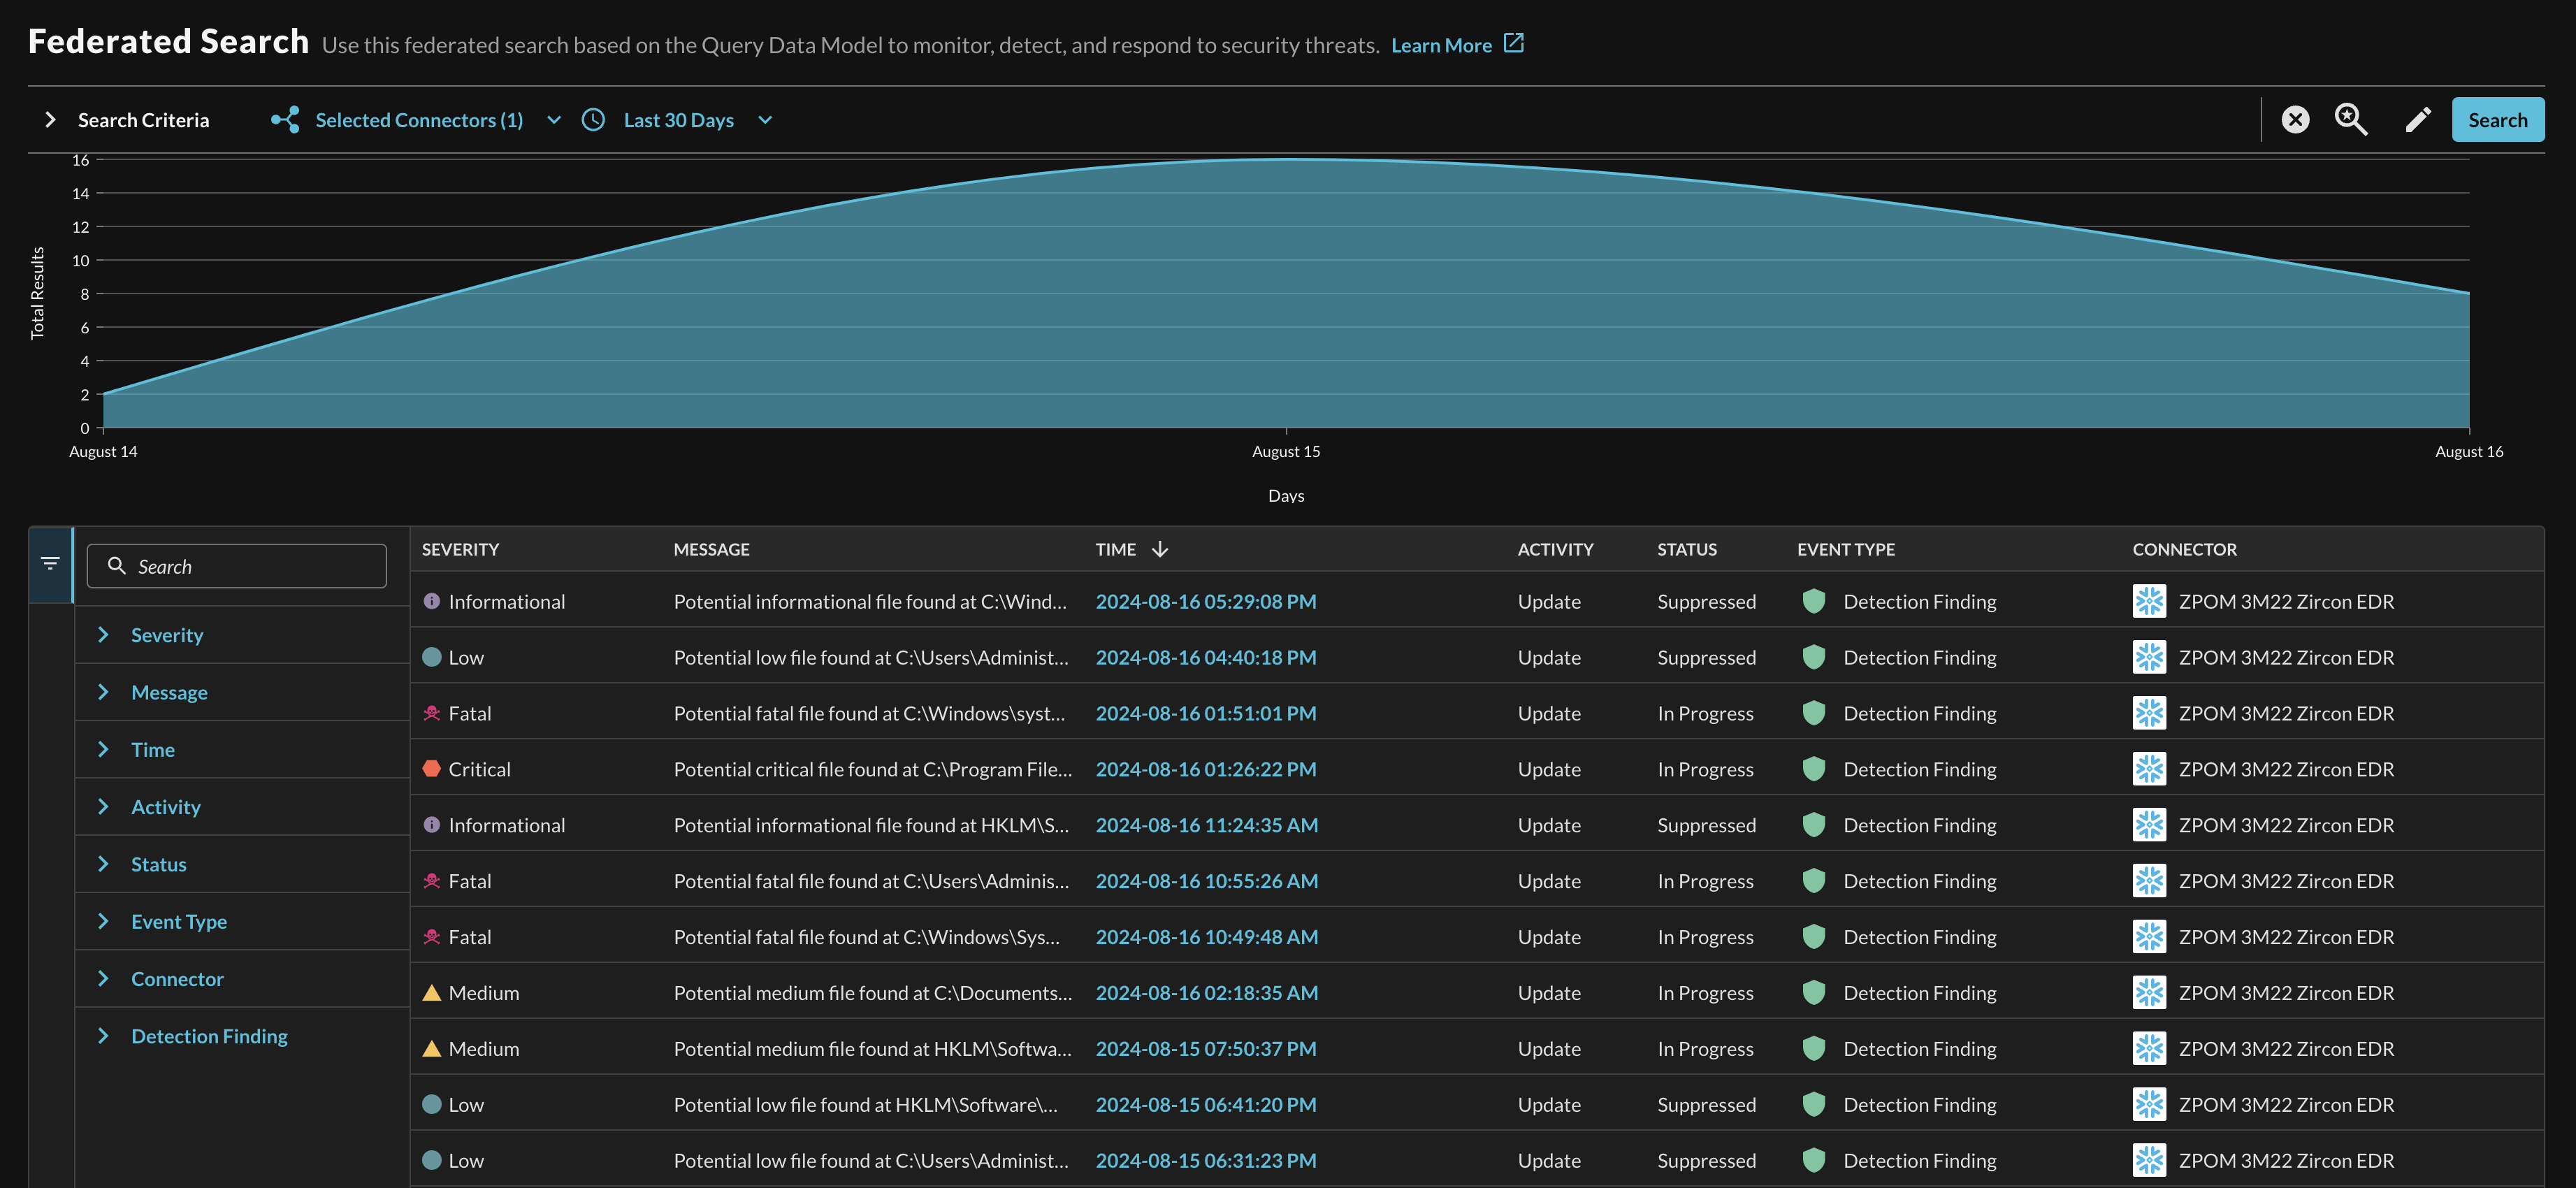
Fig. 6 - An example of the results grid fully populated by a federated search
Returning to the area chart that aggregates the result set, the X-Axis is completely dynamic and depends on your time range selection and the data returned. Hovering over the various points on the X-Axis will present a pop-up showing how many specific QDM/OCSF Events were aggregated in that time range, as shown below (Fig. 7). As of now, this is a non-interactive visualization.
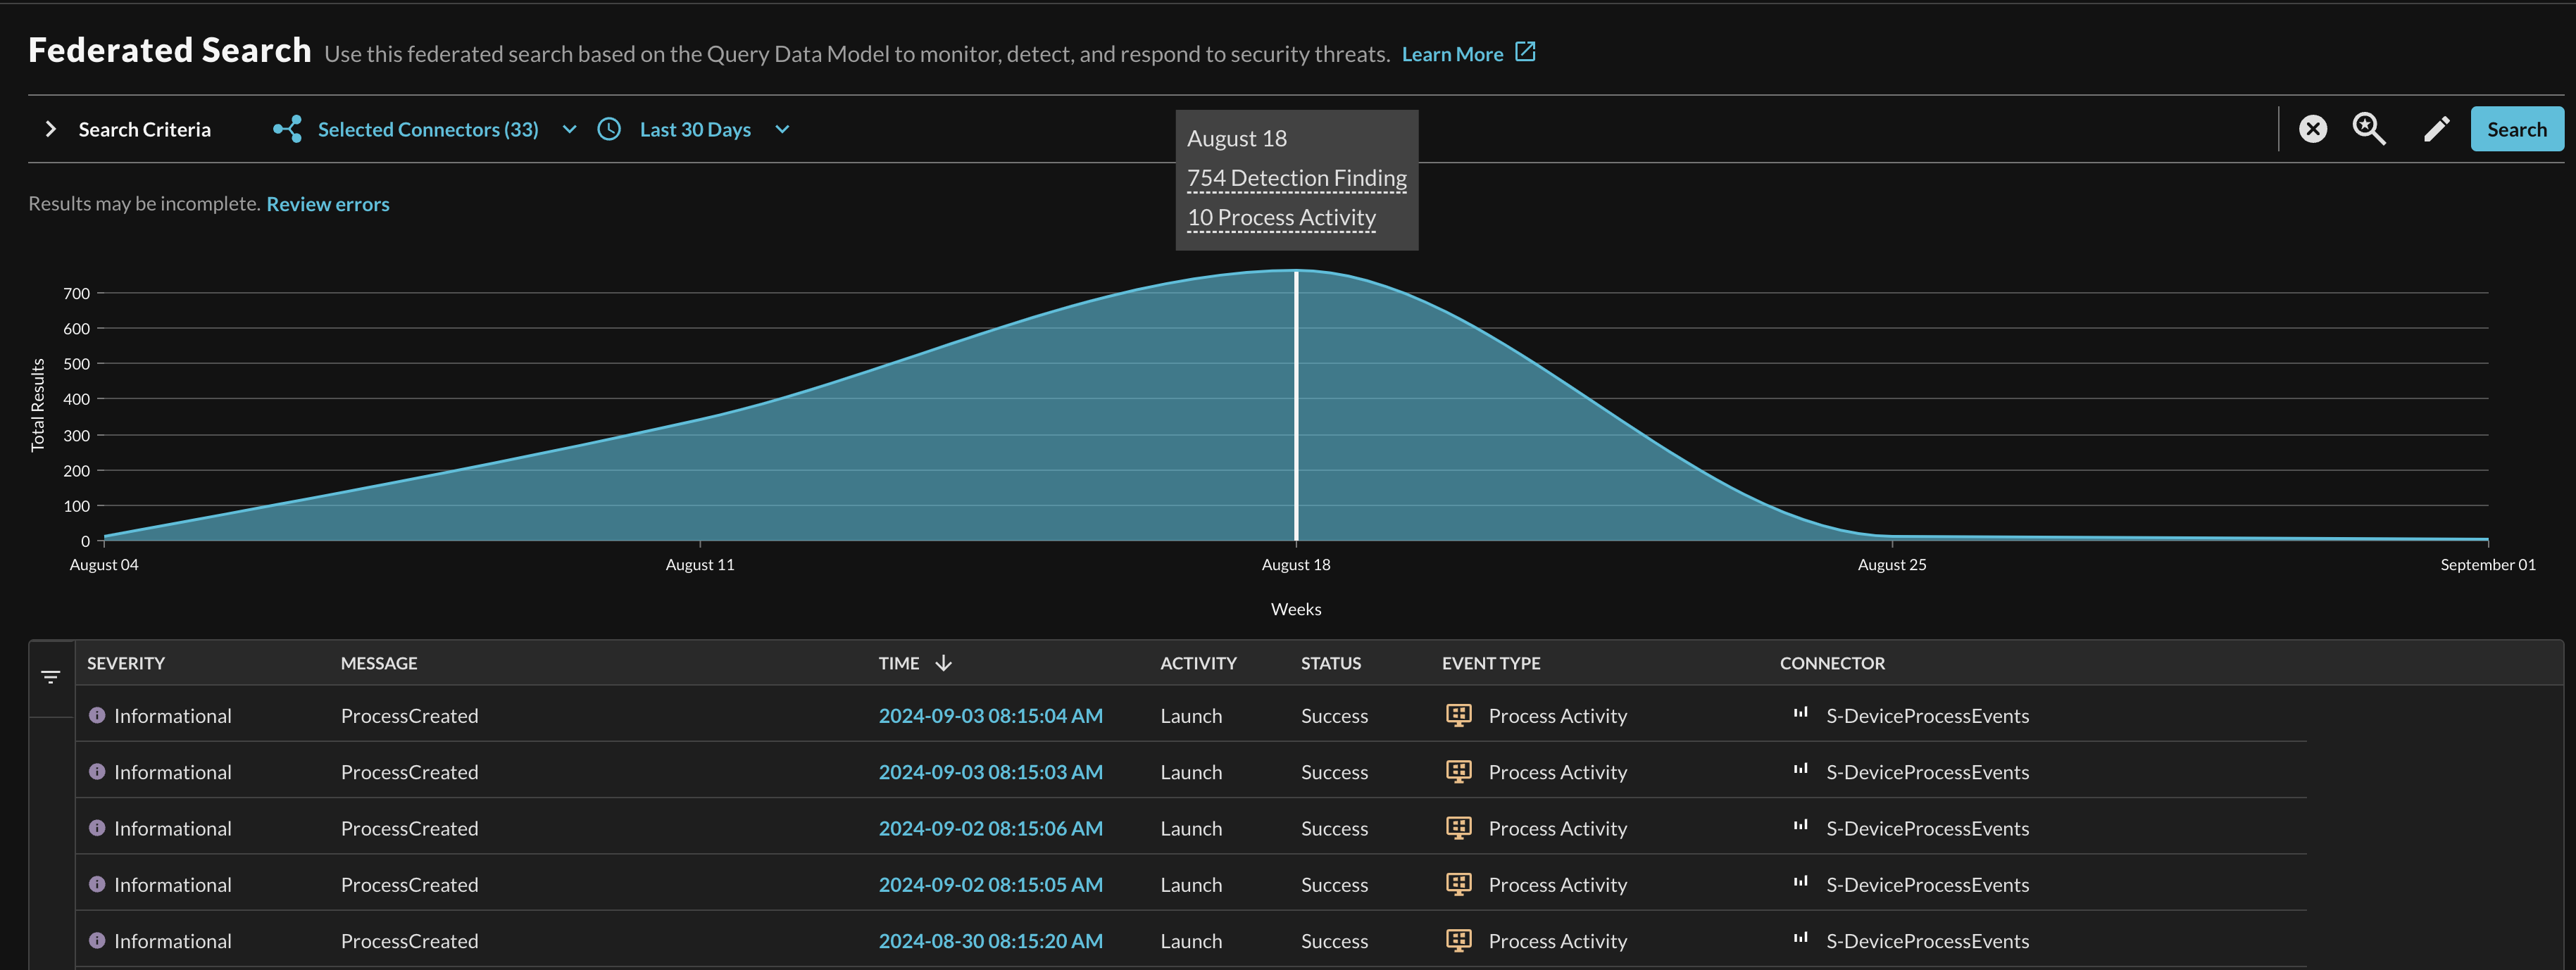
Fig. 7 - Hover state on the results area chart highlight aggregated events in a specific time range
The filter section is multi-layered and can accomplish several tasks. Firstly, at the top of the expandable results pane is a search bar, this particular search bar is used to search for specific filters such as Connector, Status, or Event-specific filters such as Detection Finding or Process Activity as shown below (Fig. 8).
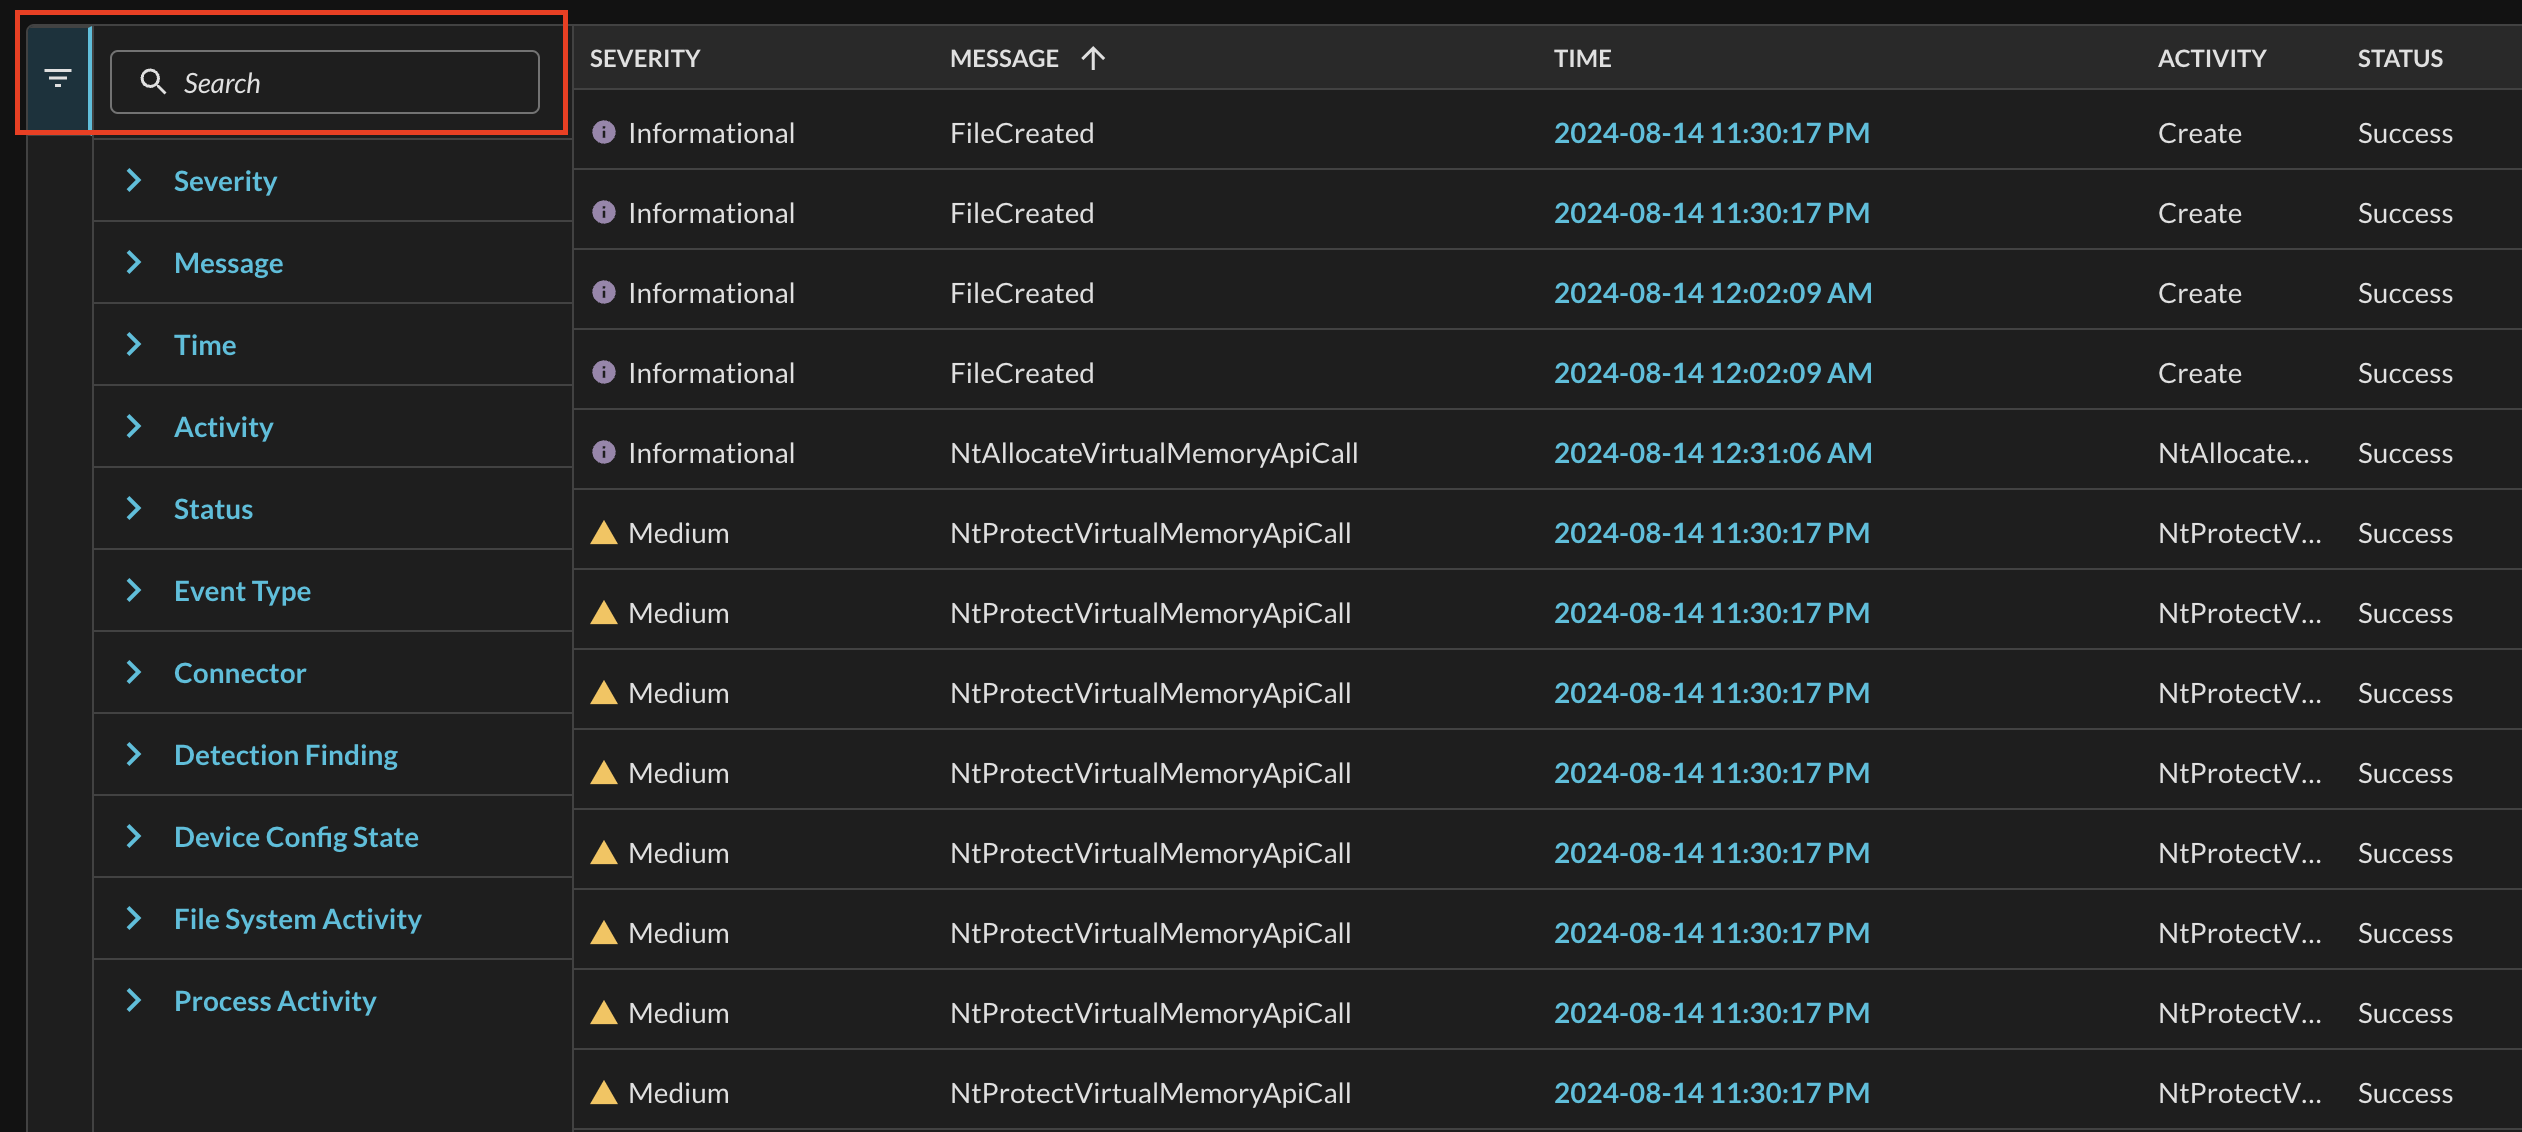
Fig. 8 - Filters search bar
Currently, there are two major interactions with filters based on the data type and values for a specific filter. Enum-backed values such as those pertaining to normalized Activity, Severity, and/or Status as well as generic scalar attributes such as user.account.uid have checkboxes with select/deselect all options. The next type is a slider for timestamp-based value such as those within Time but also in attribute-specific time windows such as user.ldap_person.last_logged_in. Both types are shown below (Fig. 9).
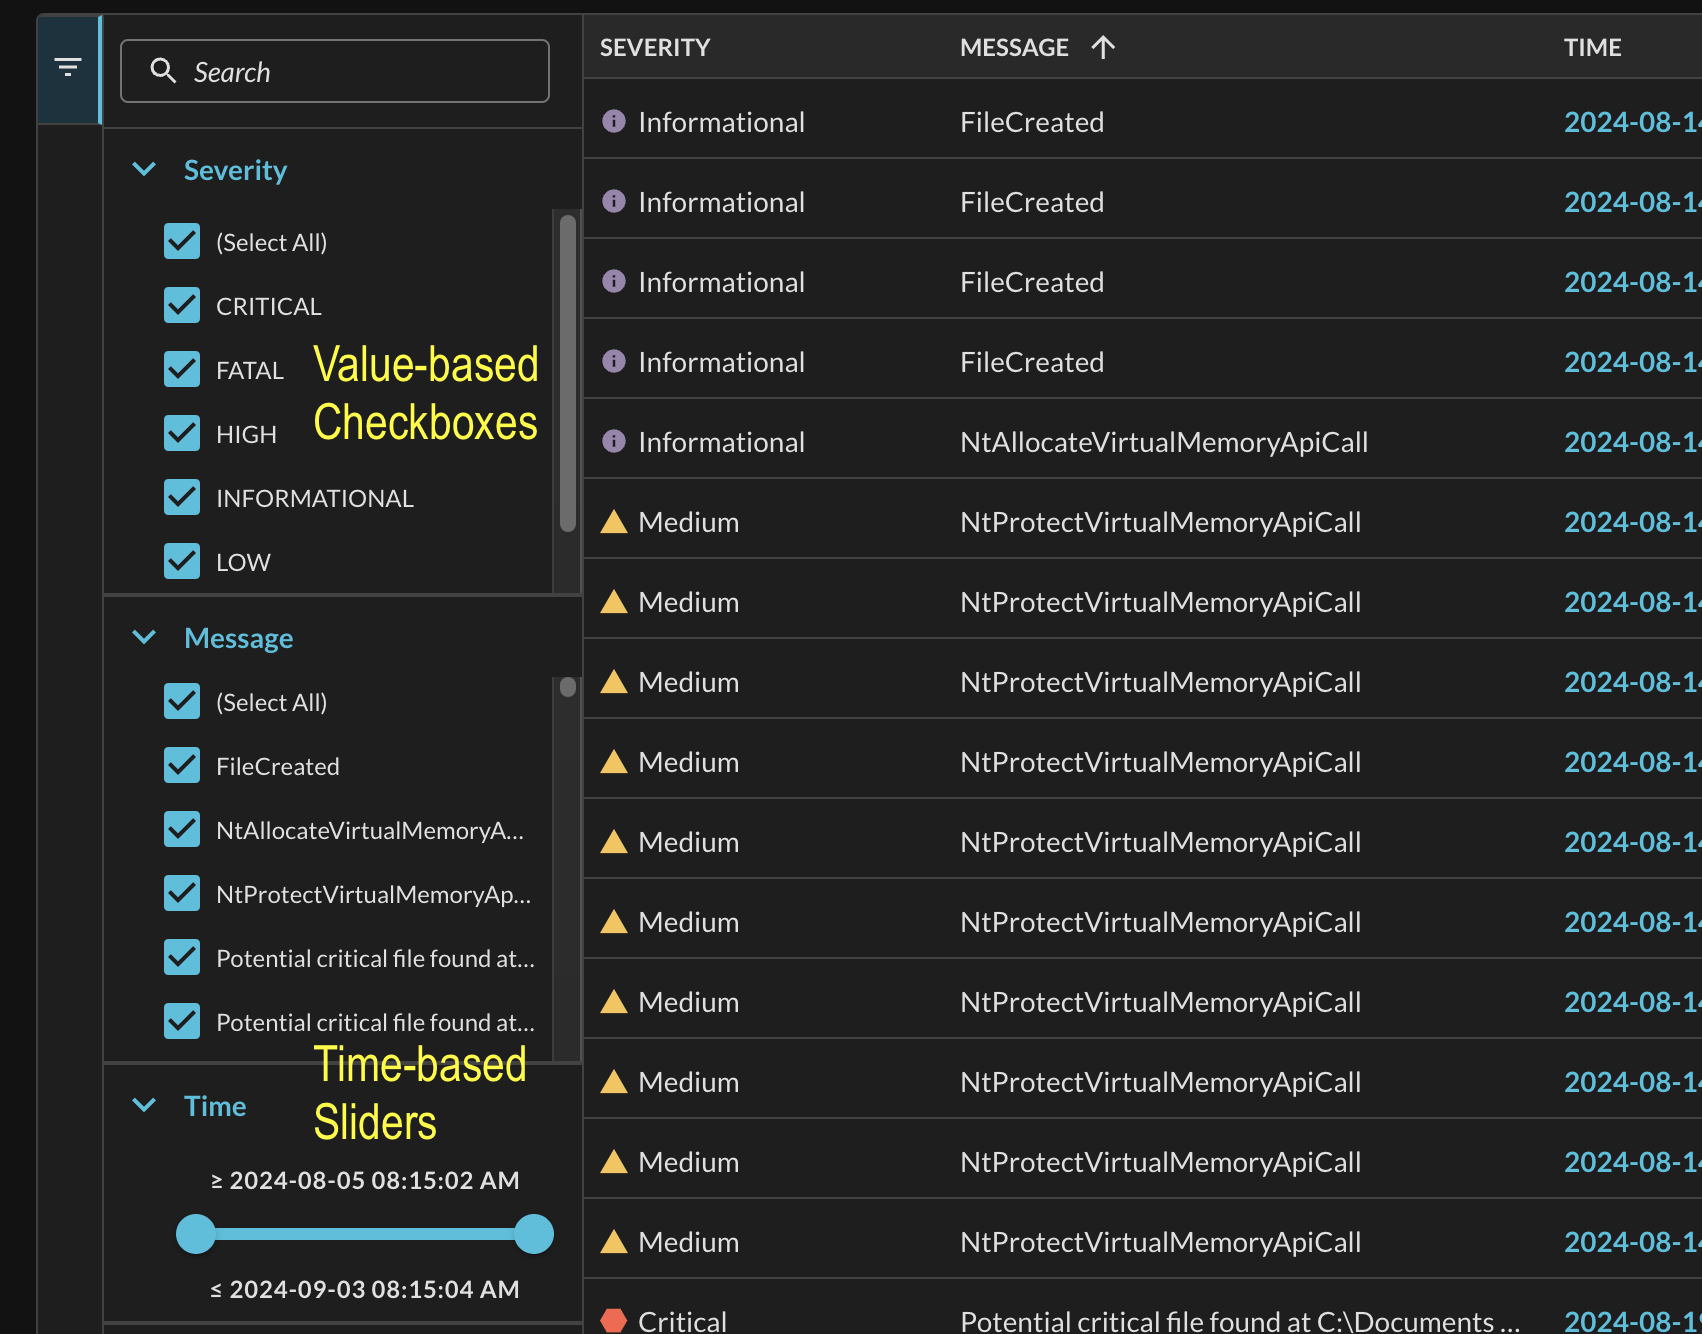
Fig. 9 - Checkbox-based and Slider-based filter options showned
Filters on Events can have several layers of nested hierarchy and directly model the schema hierarchy of QDM/OCSF where specific values can be nested on various Objects which contain context-specific data such as the actor object containing information about external processes, sessions, and users and the process object containing detailed attributes about processes such as the Process ID (pid) or Process Name (name).
The filters are nested 1:1 to the same hierarchy level within the schema and the names of the filters use the "human readable" Captions as defined in the QDM/OCSF schema. Depending on how the data is mapped from a source Connector, there can be up to 10-levels of depth in the QDM/OCSF schema. For examples of navigating deeply nested filters, refer to the screenshot below (Fig. 10) showing 5 levels of depth from detection_finding.actor.process.parent_process.pid.
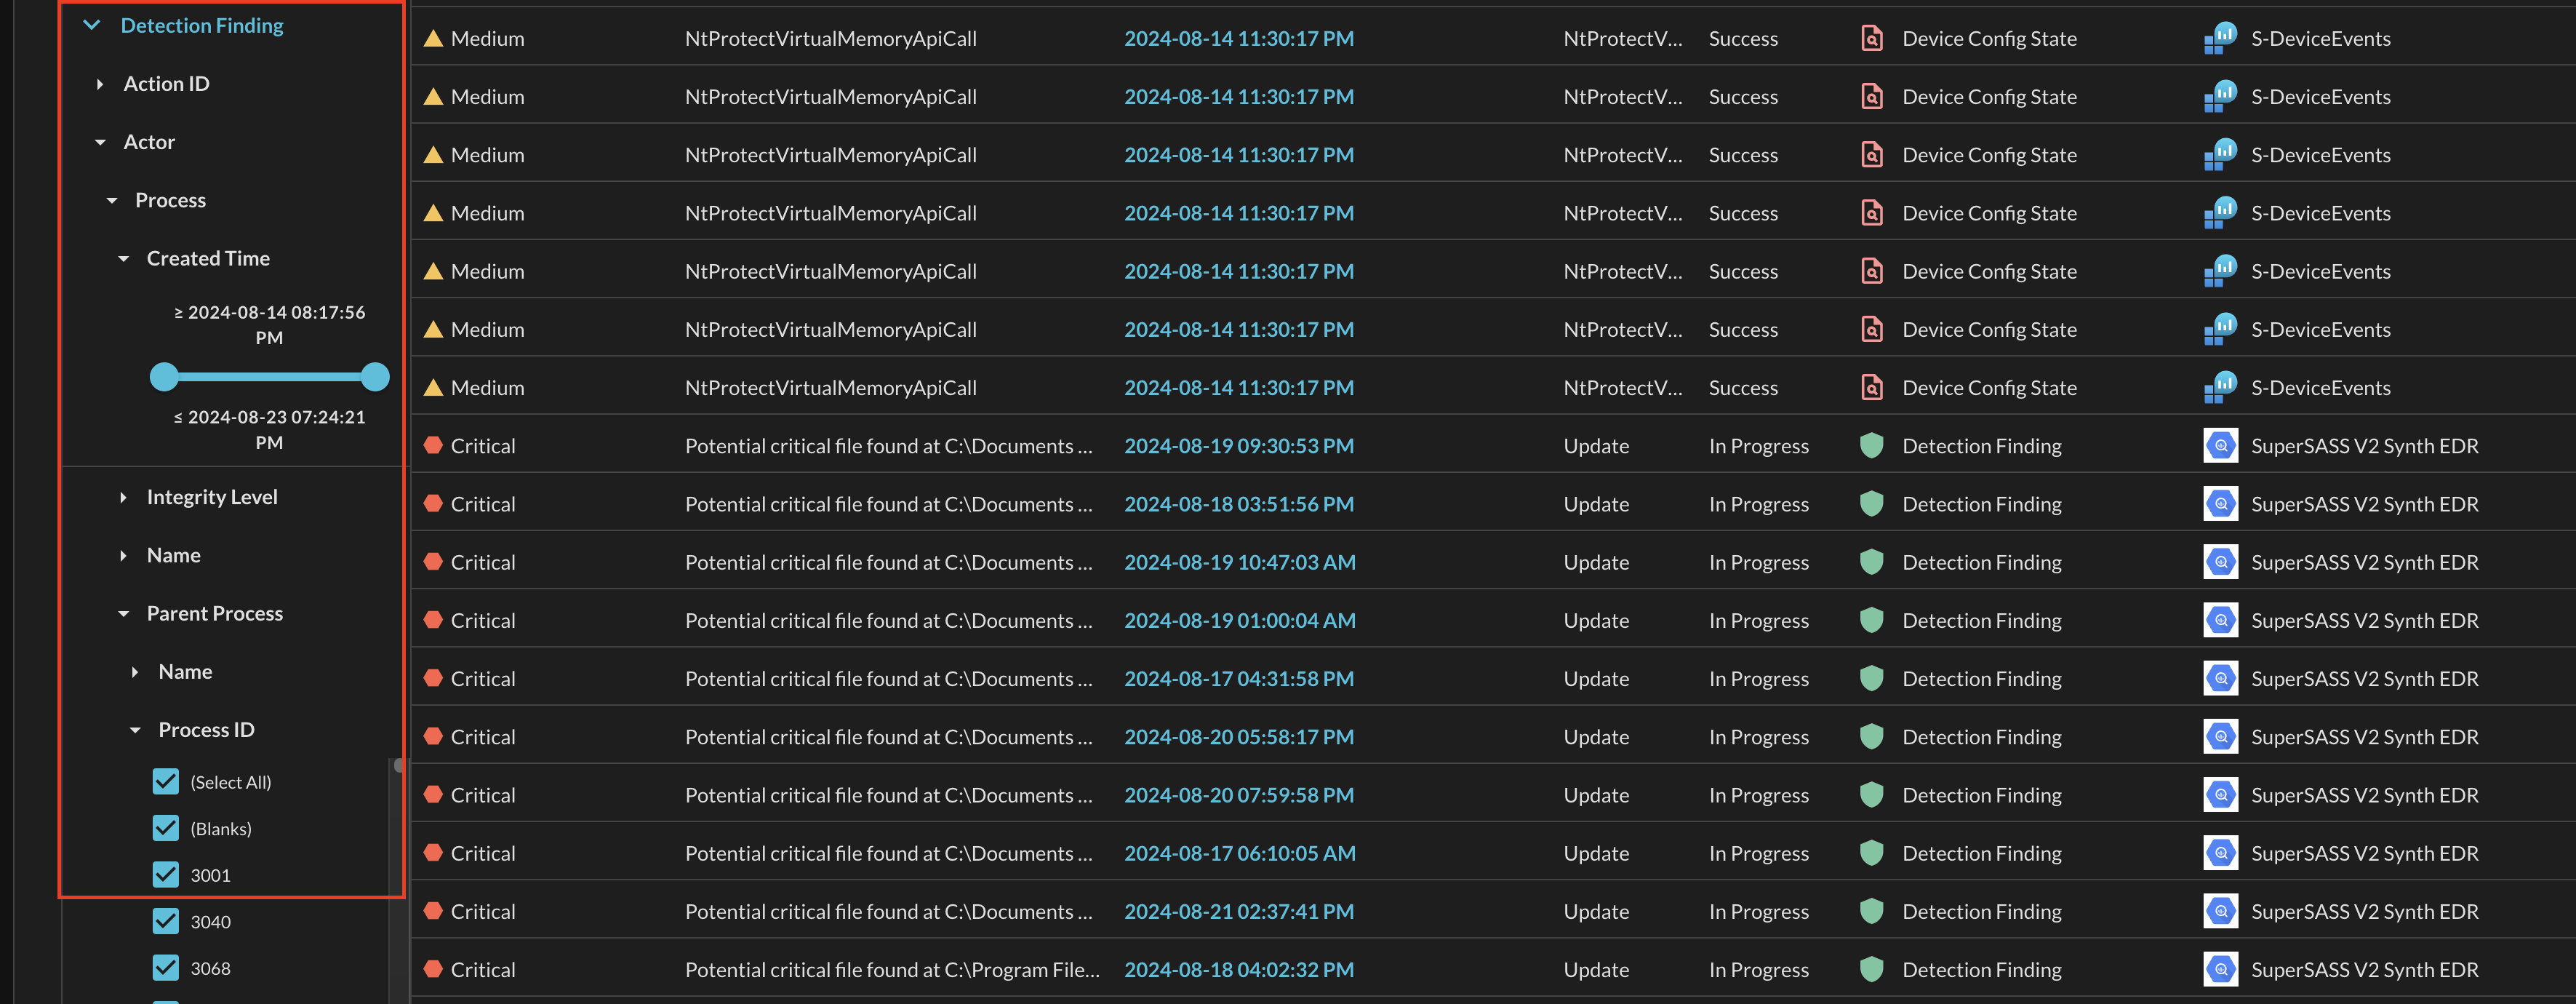
Fig. 10 - Example of a 5-layer deep nested filter option
Finally, in the results grid itself every single default column can be sorted. The columns shown represent data that is normalized at the "top level" (also known as the base_event) of every QDM/OCSF Event. This includes normalized severity, an optional message or title, the timestamp, normalized activity and status (specific to the event), the Event type, and the name of the Connector along with an icon of the upstream data source. Simply toggling each column will alternative between ascending, descending, and non-sorted. Ascending/descending and non-sorted options are denoted by the presence of a directional arrow or it's absence, respectively, in the column as shown below (Fig. 11).

Fig. 11 - Column sorting icons
Additionally, columns can be rearranged by clicking and dragging them, they can also be removed altogether by dragging the column outside of the boundary of the grid itself as shown below (Fig. 12). It is important to note that removed columns cannot be retrieved unless the results grid is refreshed, in the future, it will be possible to customize the columns from a selector pane similar to Filters.
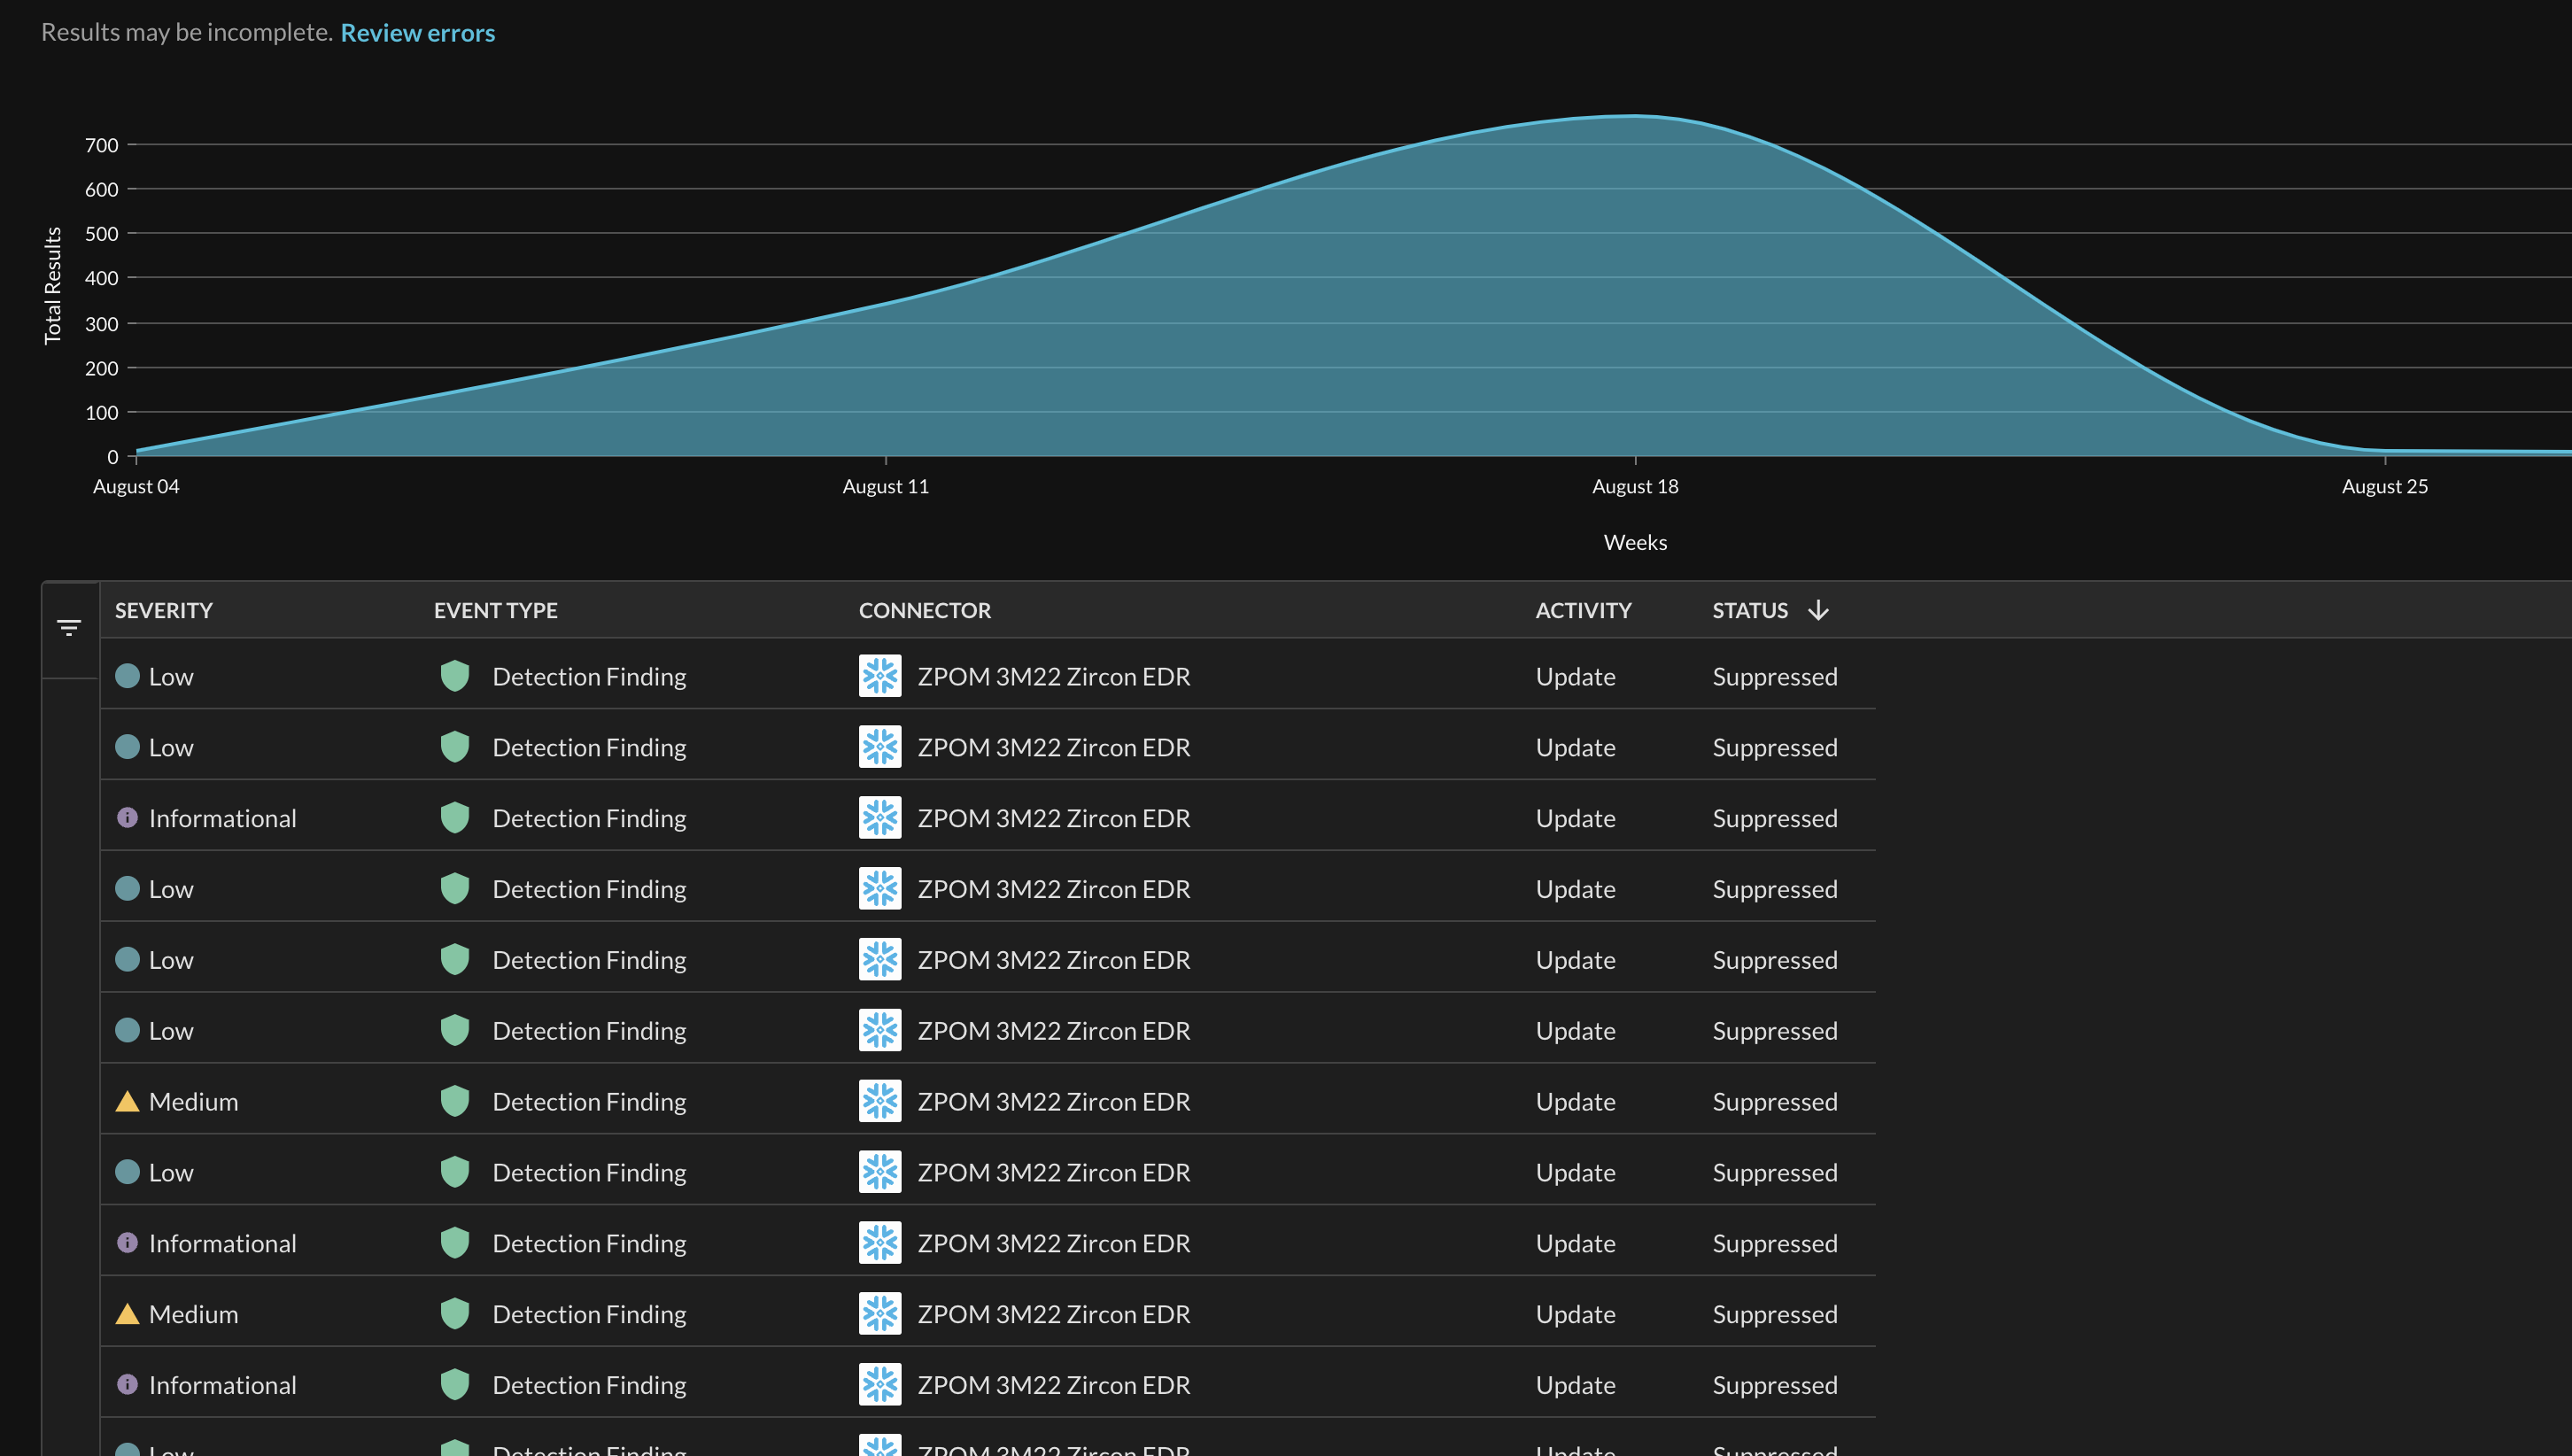
Fig. 12 - Rearranging and removing columns from the results grid
Values within each row and column of the grid can be copy and pasted by selecting the specific value and using keyboard shortcuts (e.g., CTRL+C or CMD+C). This functionality is also extended into the results detailed view which is covered in the next section.
Right-clicking on the grid brings more optionality by allowing you to copy and paste the value along with its matching header, and it also allows you to export the entire grid to a CSV file, as shown below (Fig. 13). These options will respect any applied filters.

Fig. 13 - Advanced grid clipboard and export to CSV options
Lastly, values that exceed a 64 character limited are truncated by default, this typical occurs in the Message column. These values can be seen by expanding the column, however, if the value is still too long truncated values will print the entire value upon hovering over it with your cursor, as shown below (Fig. 14).

Fig. 14 - Truncated value hover state
In the next section you will learn how to interact with the specific results details returned from every Event. This deeply nested data, along with raw JSON data, can be helpful for incident responders, threat hunters, investigators, audit, compliance, and architecture teams to gather specific data.
Results Detail Navigation
To view the result of any given Event within the results grid, select the highlighted value within the Time column. A new navigation pane will open on the right-hand side of the screen presenting a results detail grid, as shown below (Fig. 15).
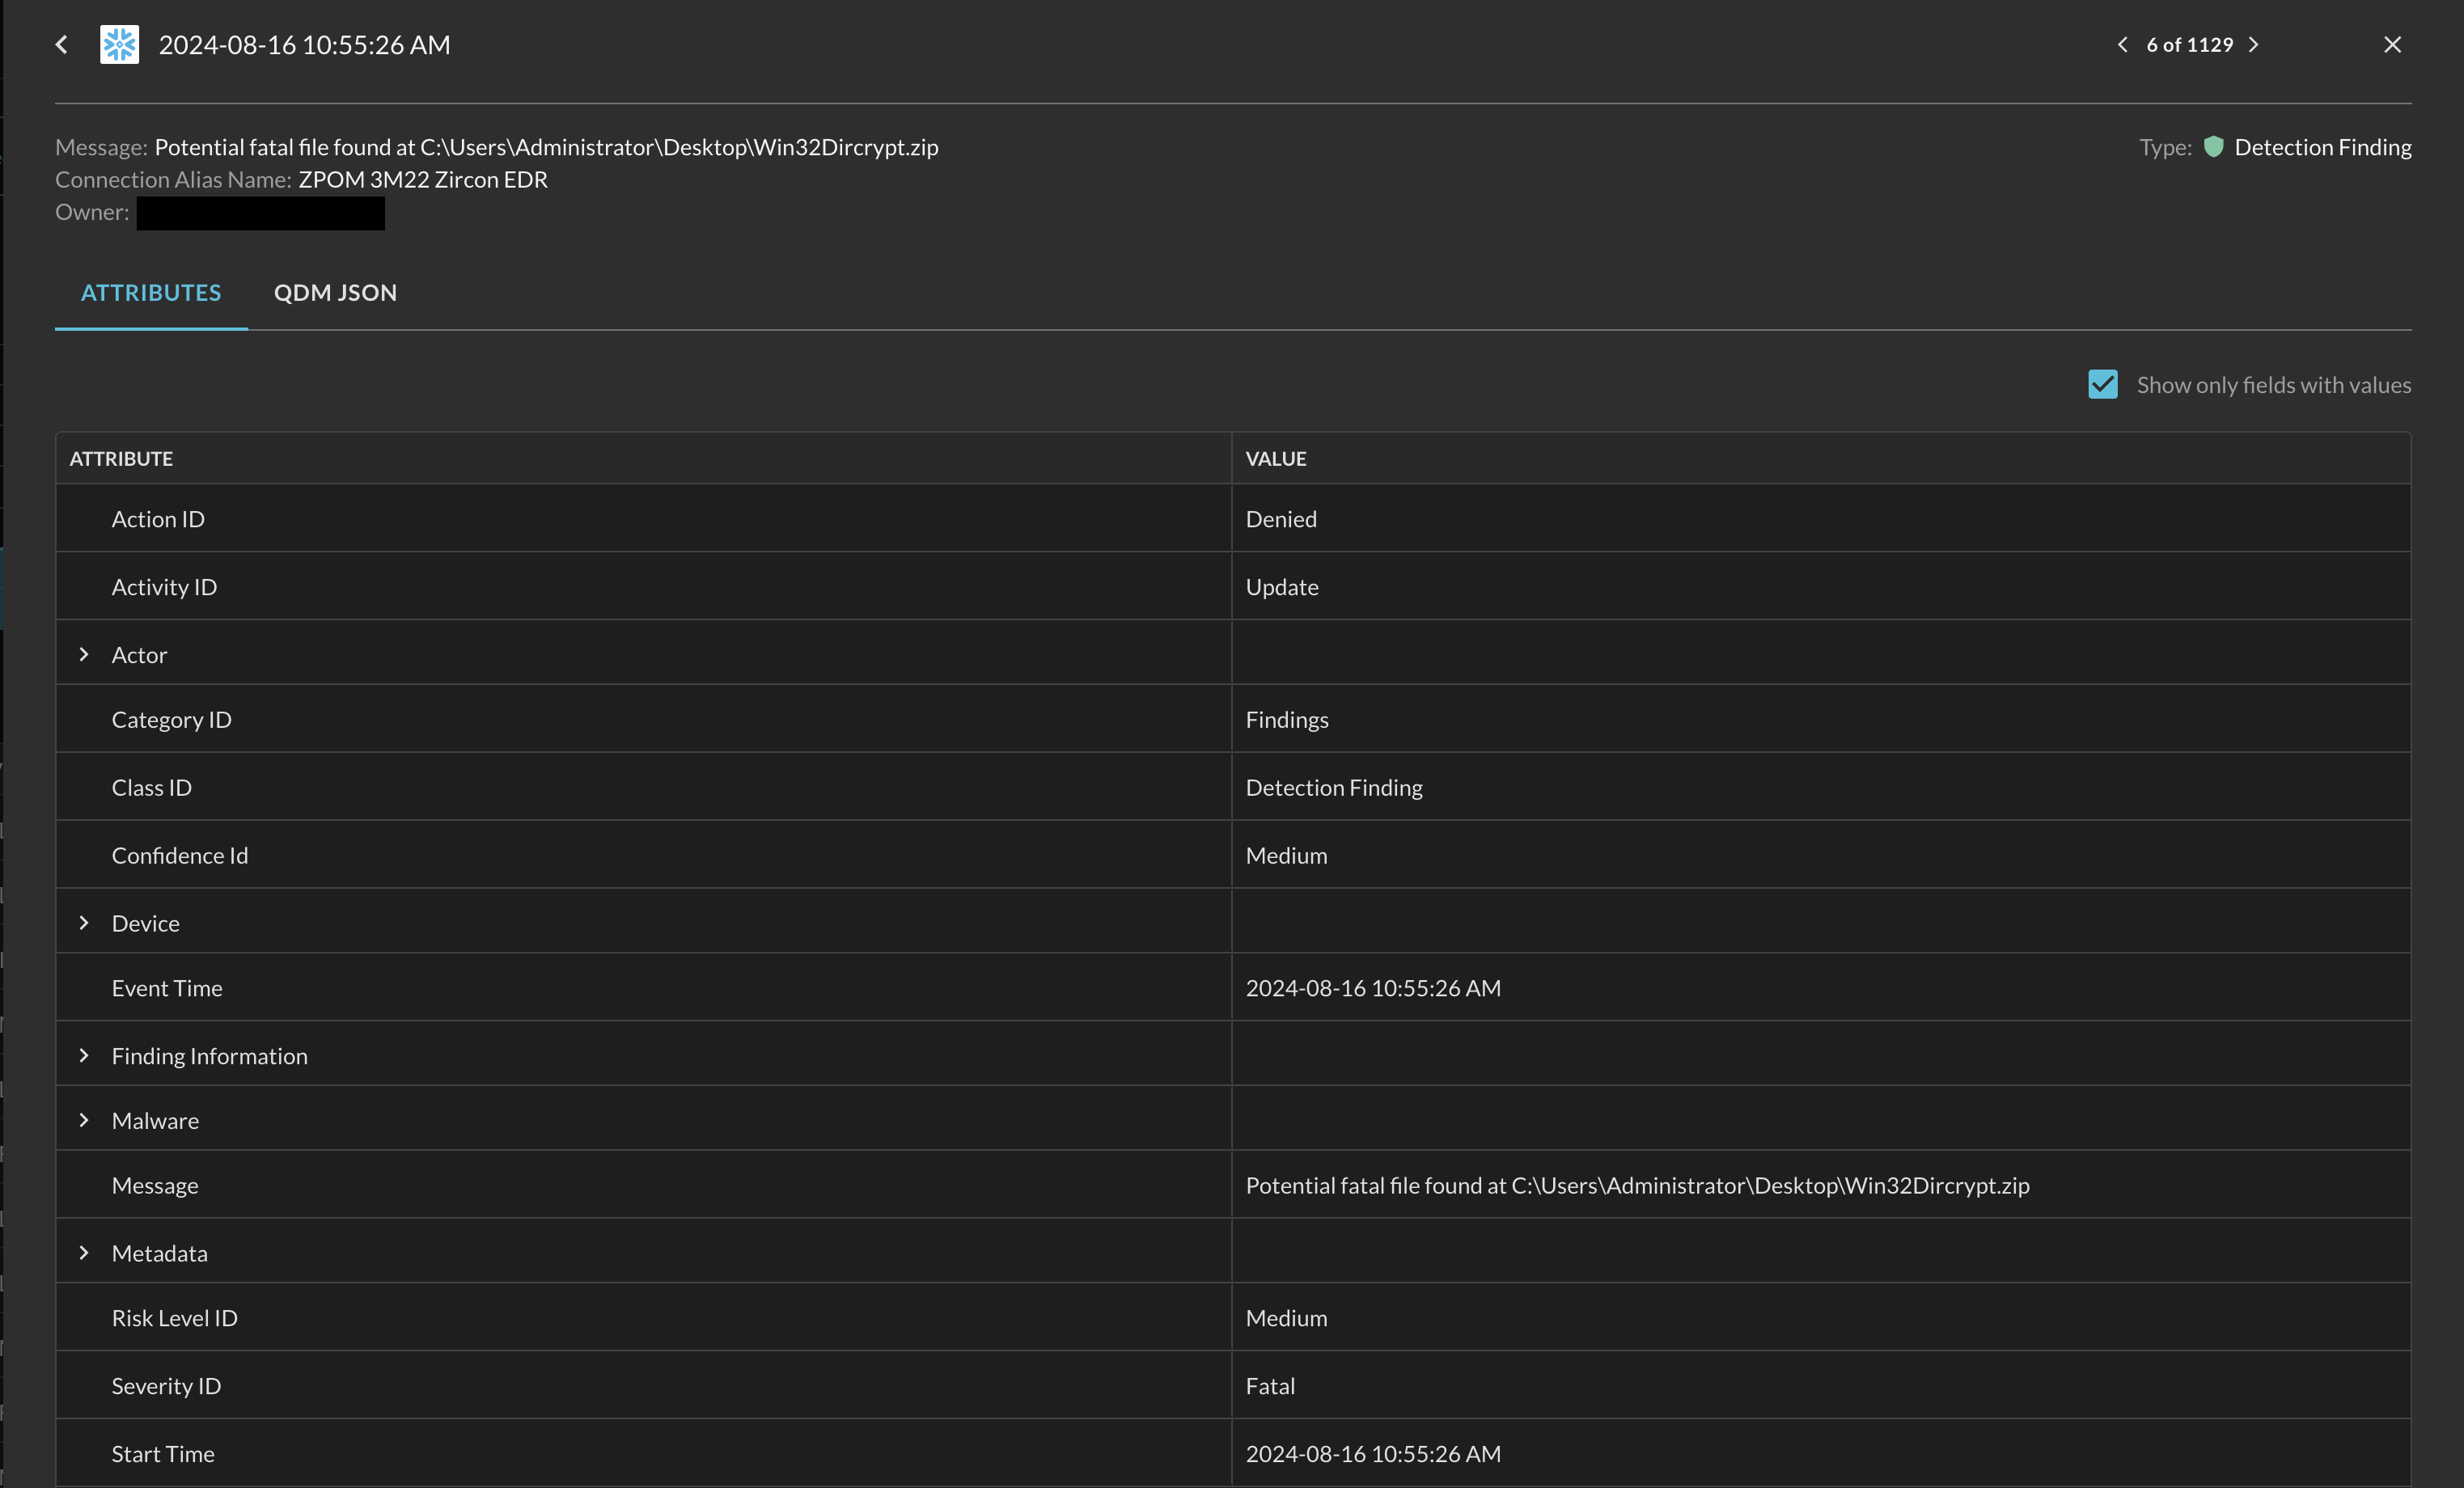
Fig. 15 - Results detail pane
Starting at the top with the unlabeled elements, on the top-left is the normalized time of the event, next to it on the top right is a navigational element that allows you to move through different result details without having to exit and manually select the next one. Highlighted at the top is the Message, the Connector (Alias) Name, and the Owner which is your Query Team created within your Query Organization.
By default the Attributes as shown with the option to Show only fields with values preselected. Attributes are key value pairs of the normalized data within the specific Event. The attribute names use the human-readably Caption and the Value can consist on a normalized enum-backed value or the raw value field from the downstream data source.
Deselecting Show only fields with values (as shown below in Fig. 16) will show all potential normalized attributes possible within the given Event class, denoted by the value of ―. Showing nulled attributes is often used as a feedback loop when mapping dynamic schema data using Configure Schema, or to provide feedback to your Query Customer Success Manager or Technical Account Manager about static schemas will missing normalized data.
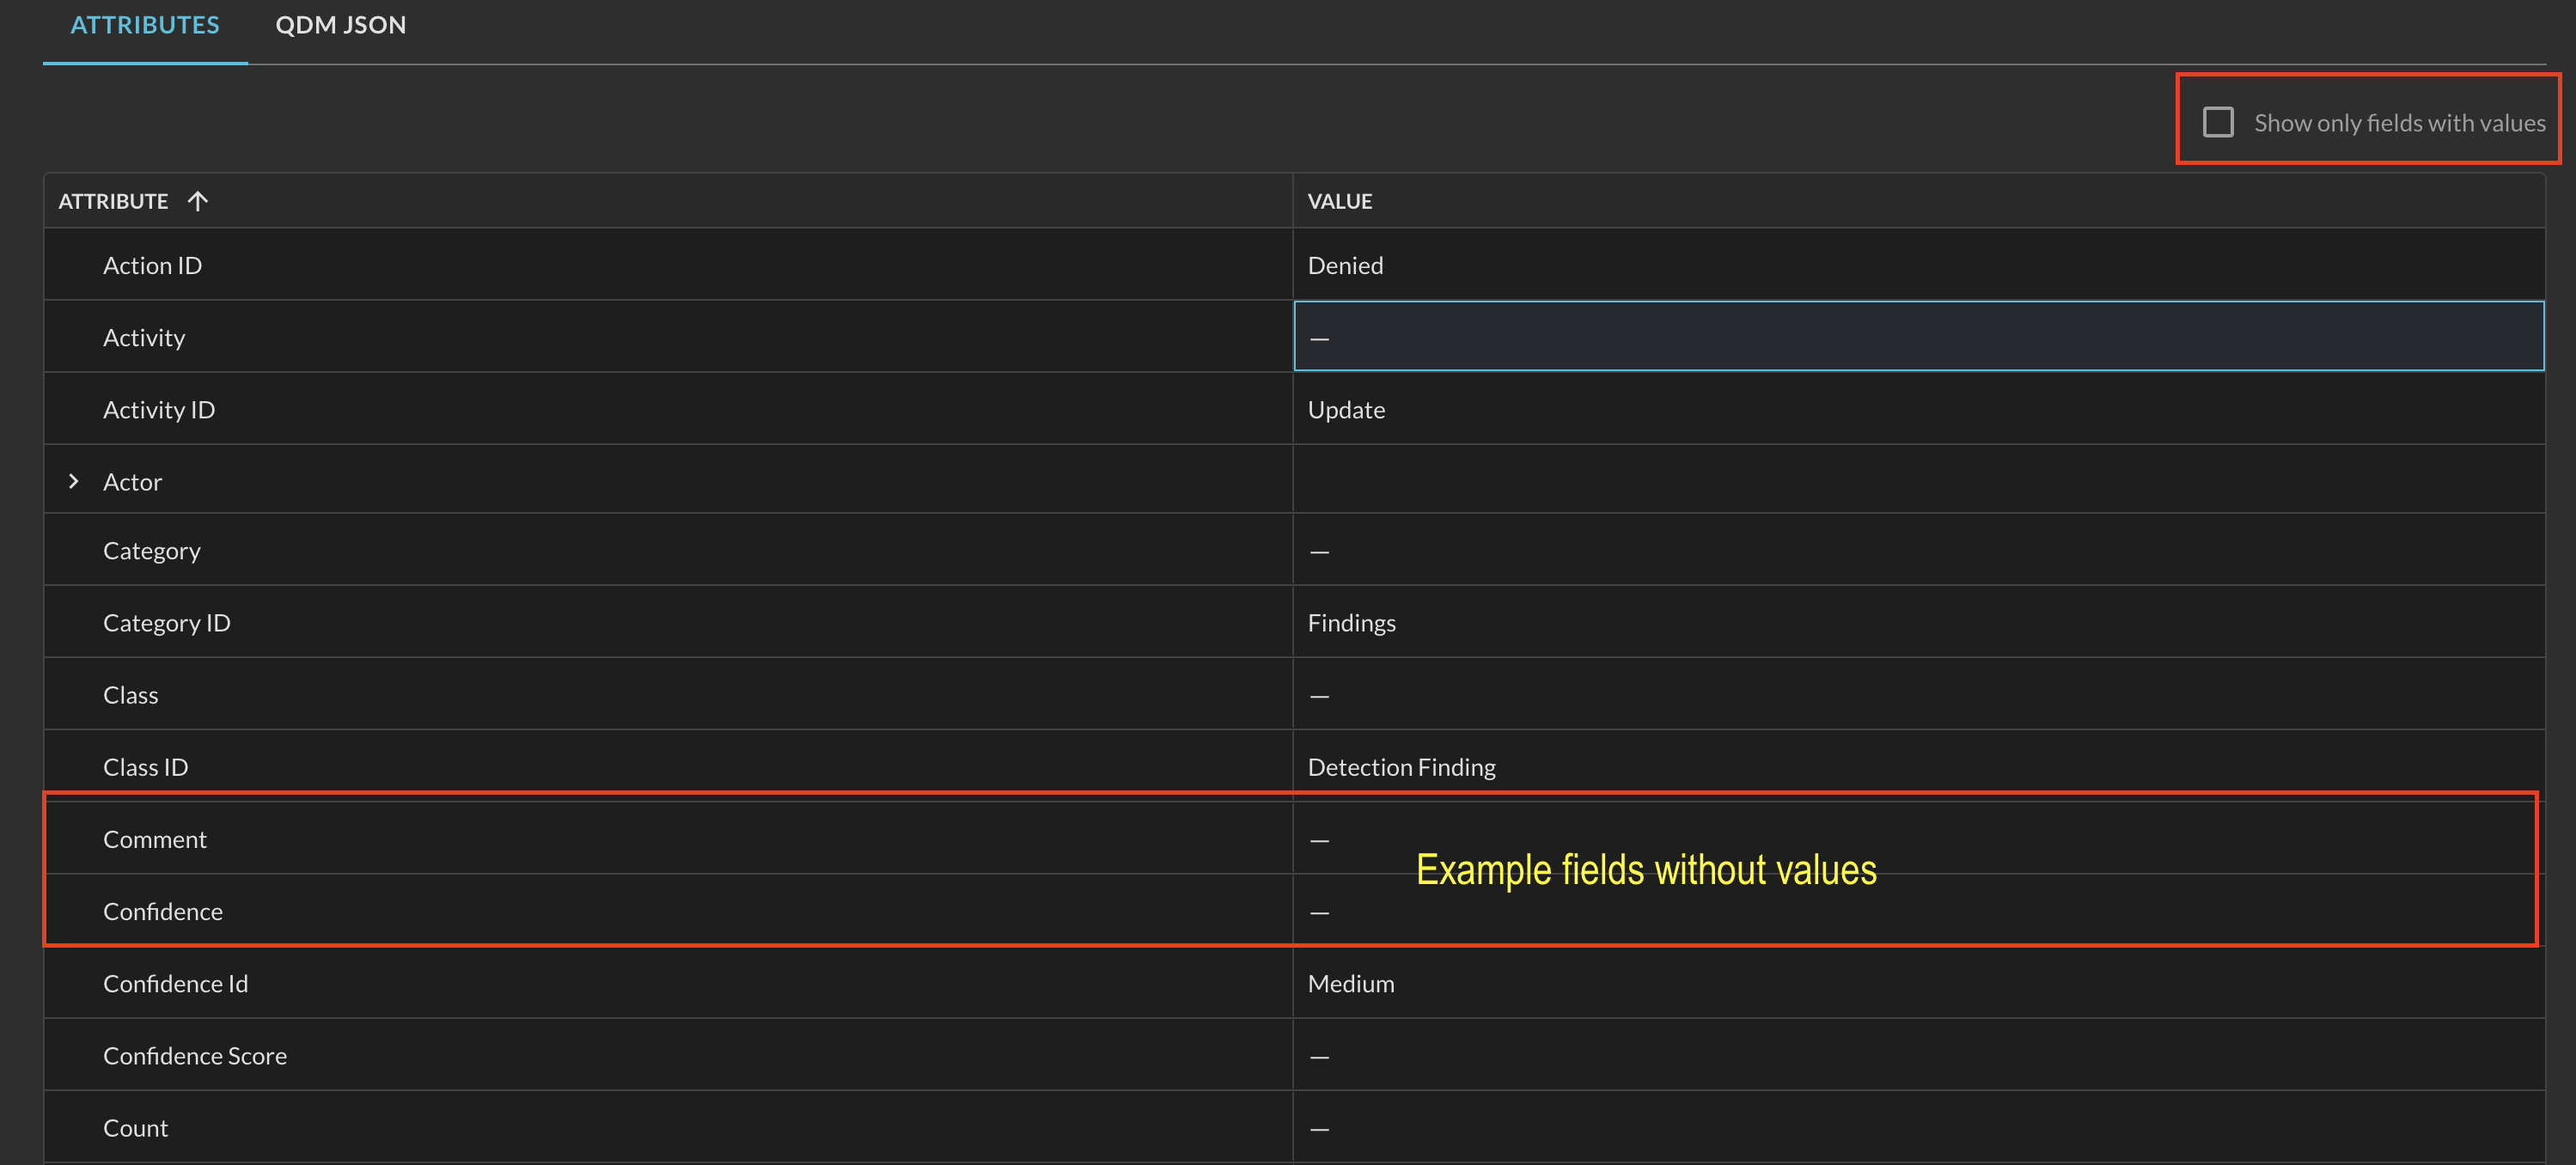
Fig. 16 - Examples of empty values in the results detail grid
Regarding showing empty values in nested fields...With nested data types, only empty fields at the current level of hierarchy will be shown and not any additional objects. For instance, if you have
actorpresent in your data set, it will not show additional sub-nested objects such assessionoruserunless they were also mapped.This can present a case where a given Event's schema may not look "fully fleshed out". Always refer to the Query Schema documentation for navigating the full depth of schema for Events and Objects.
Viewing deeply-nested data within the results detail grid is the same as navigating deep-nested filters, they're both denoted by toggleable karats. Each karat maintains the toggle state it was in, for instance, in the example shown below (Fig. 17) if you collapse the value for Actor, the nested values for Process and Parent Process would remain expanded.
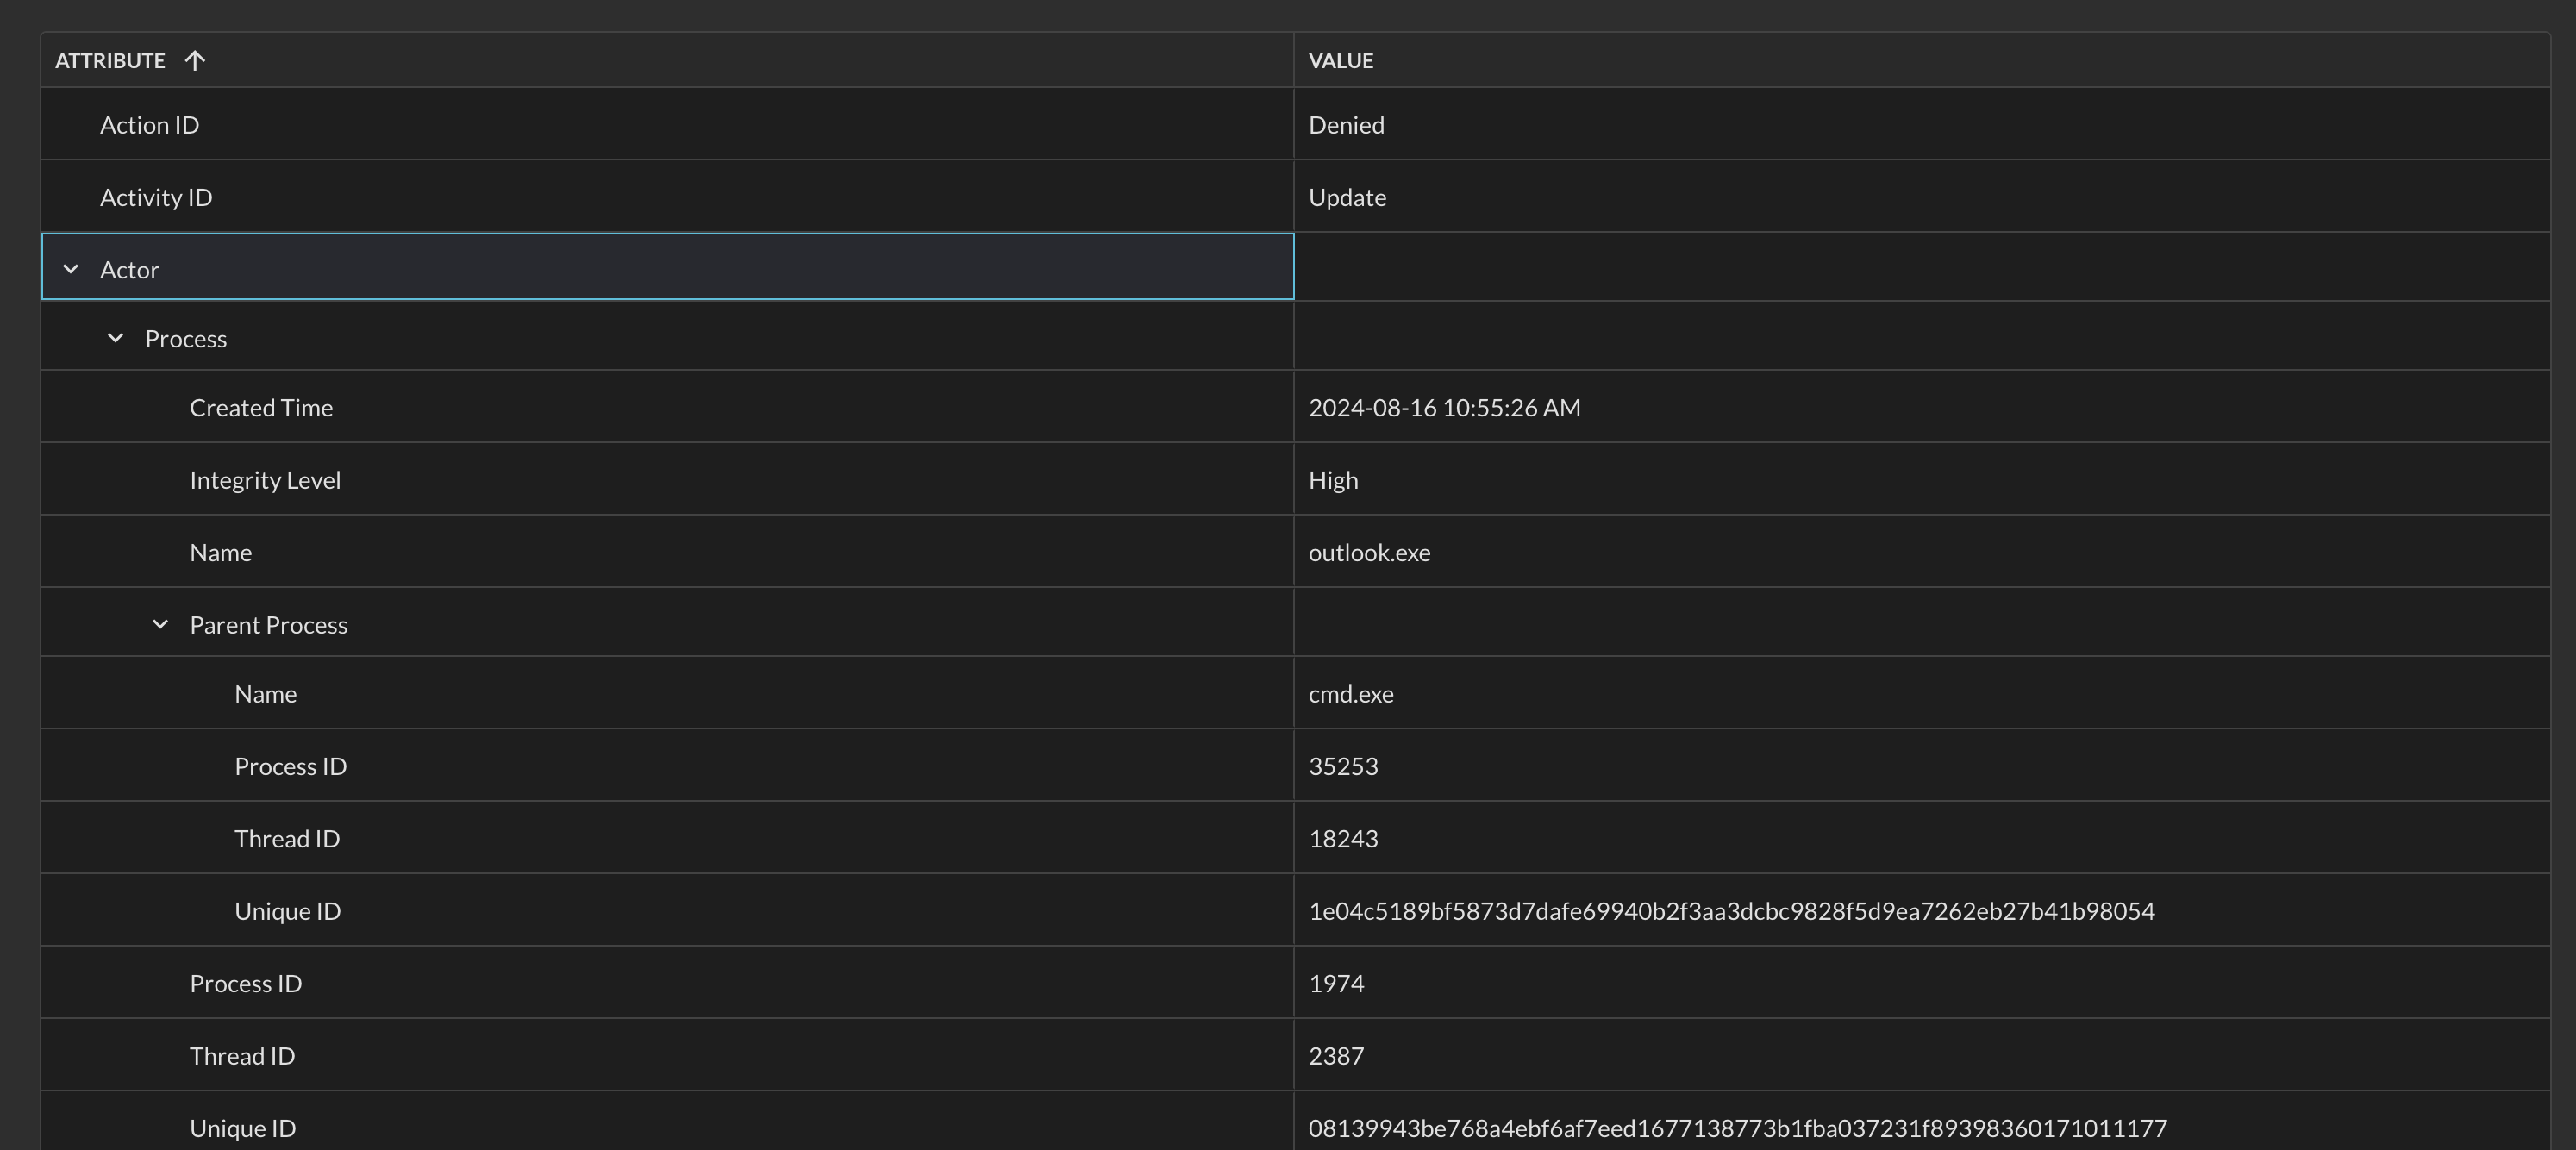
Fig. 17 - Toggling deep nested attributes within the results detail grid
Just like the main results grid, keyboard shortcuts for copying and pasting can be used as well as right-clicking to copy values with headers (in this case, the Attribute Name) and export to CSV. Additionally, the columns retain the same sorting capability.
The QDM JSON tab presents the normalized data in its raw key-value pair format post-normalization from Query (as shown below in Fig. 18). Additionally, specific metadata such as an internal record_id is provided along with raw_data for certain connectors which maintains a JSON dictionary of the raw data from the downstream source, regardless if it is normalized.
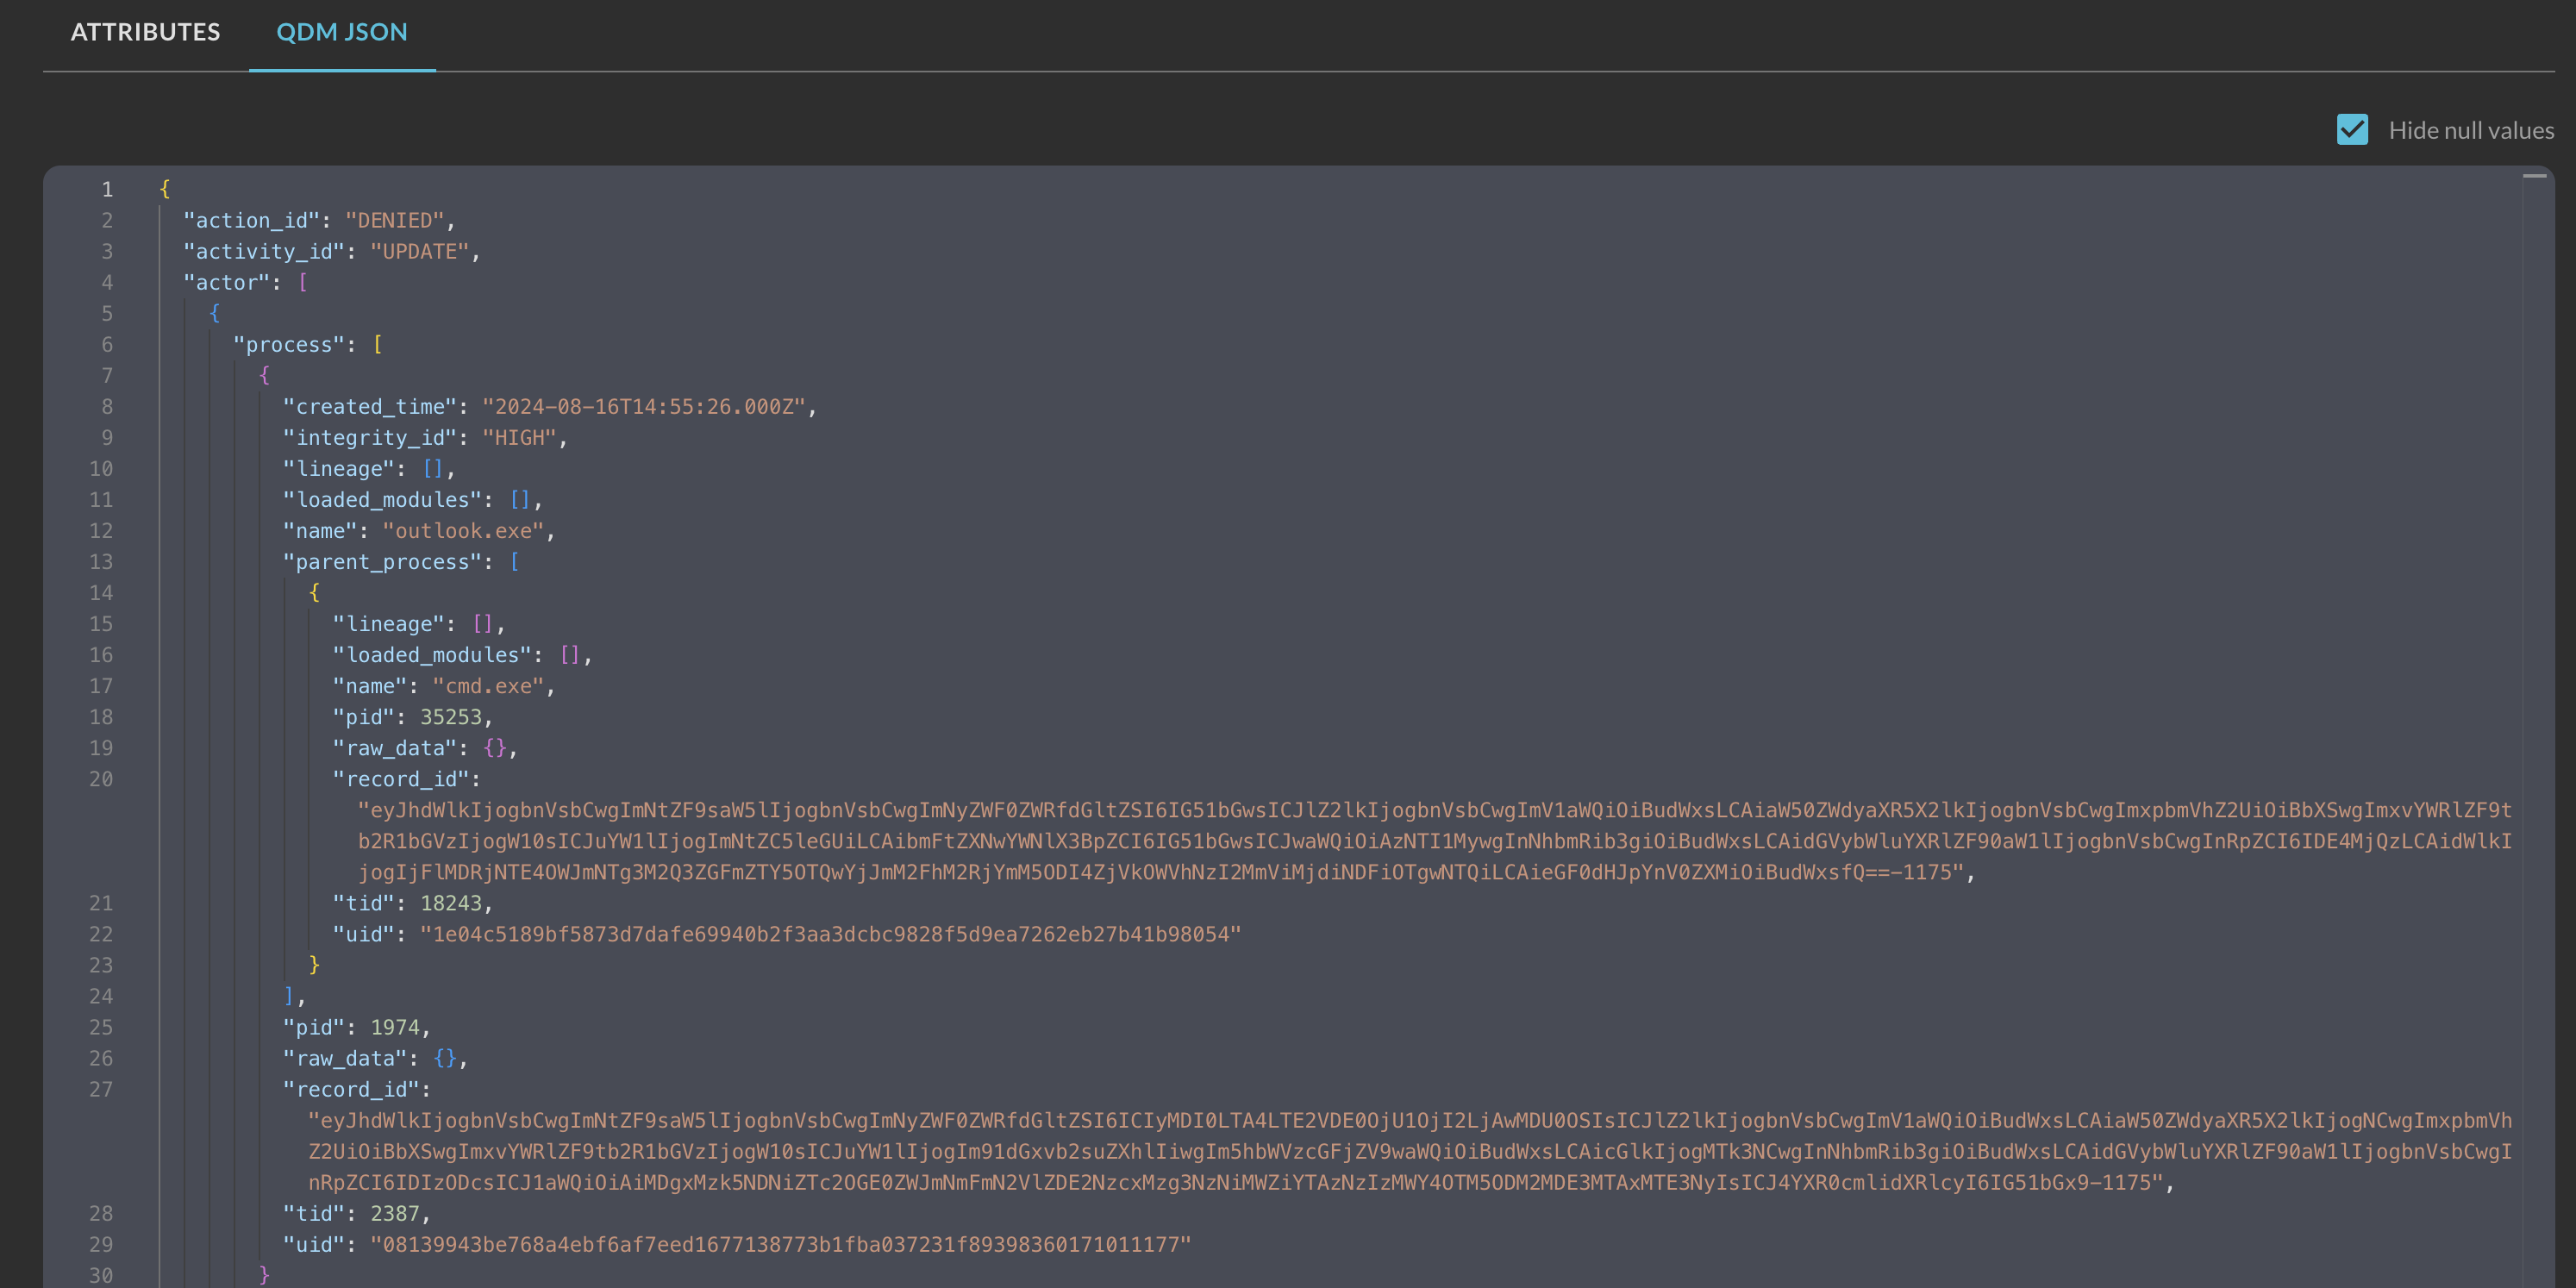
Fig. 18 - QDM JSON view
Similar to the Attributes grid, an option to hide null values - Hide null values - is provided, and is selected by default. Similar to the results grid, only values at the current amount of nested data are shown, and nothing additional.
To select all for copying the JSON values out, select any value inside of the JSON reader and use CRTL + A or CMD + A and copy and paste as normal.
To search for specific keys or values, select any value inside of the JSON reader and use CTRL + F or CMD + F to bring up a VSCode-based search bar as shown below (Fig. 19). This provides the same level of specificity such as case sensitive, case matching, and other search options directly in the JSON for finding data points in large datasets.
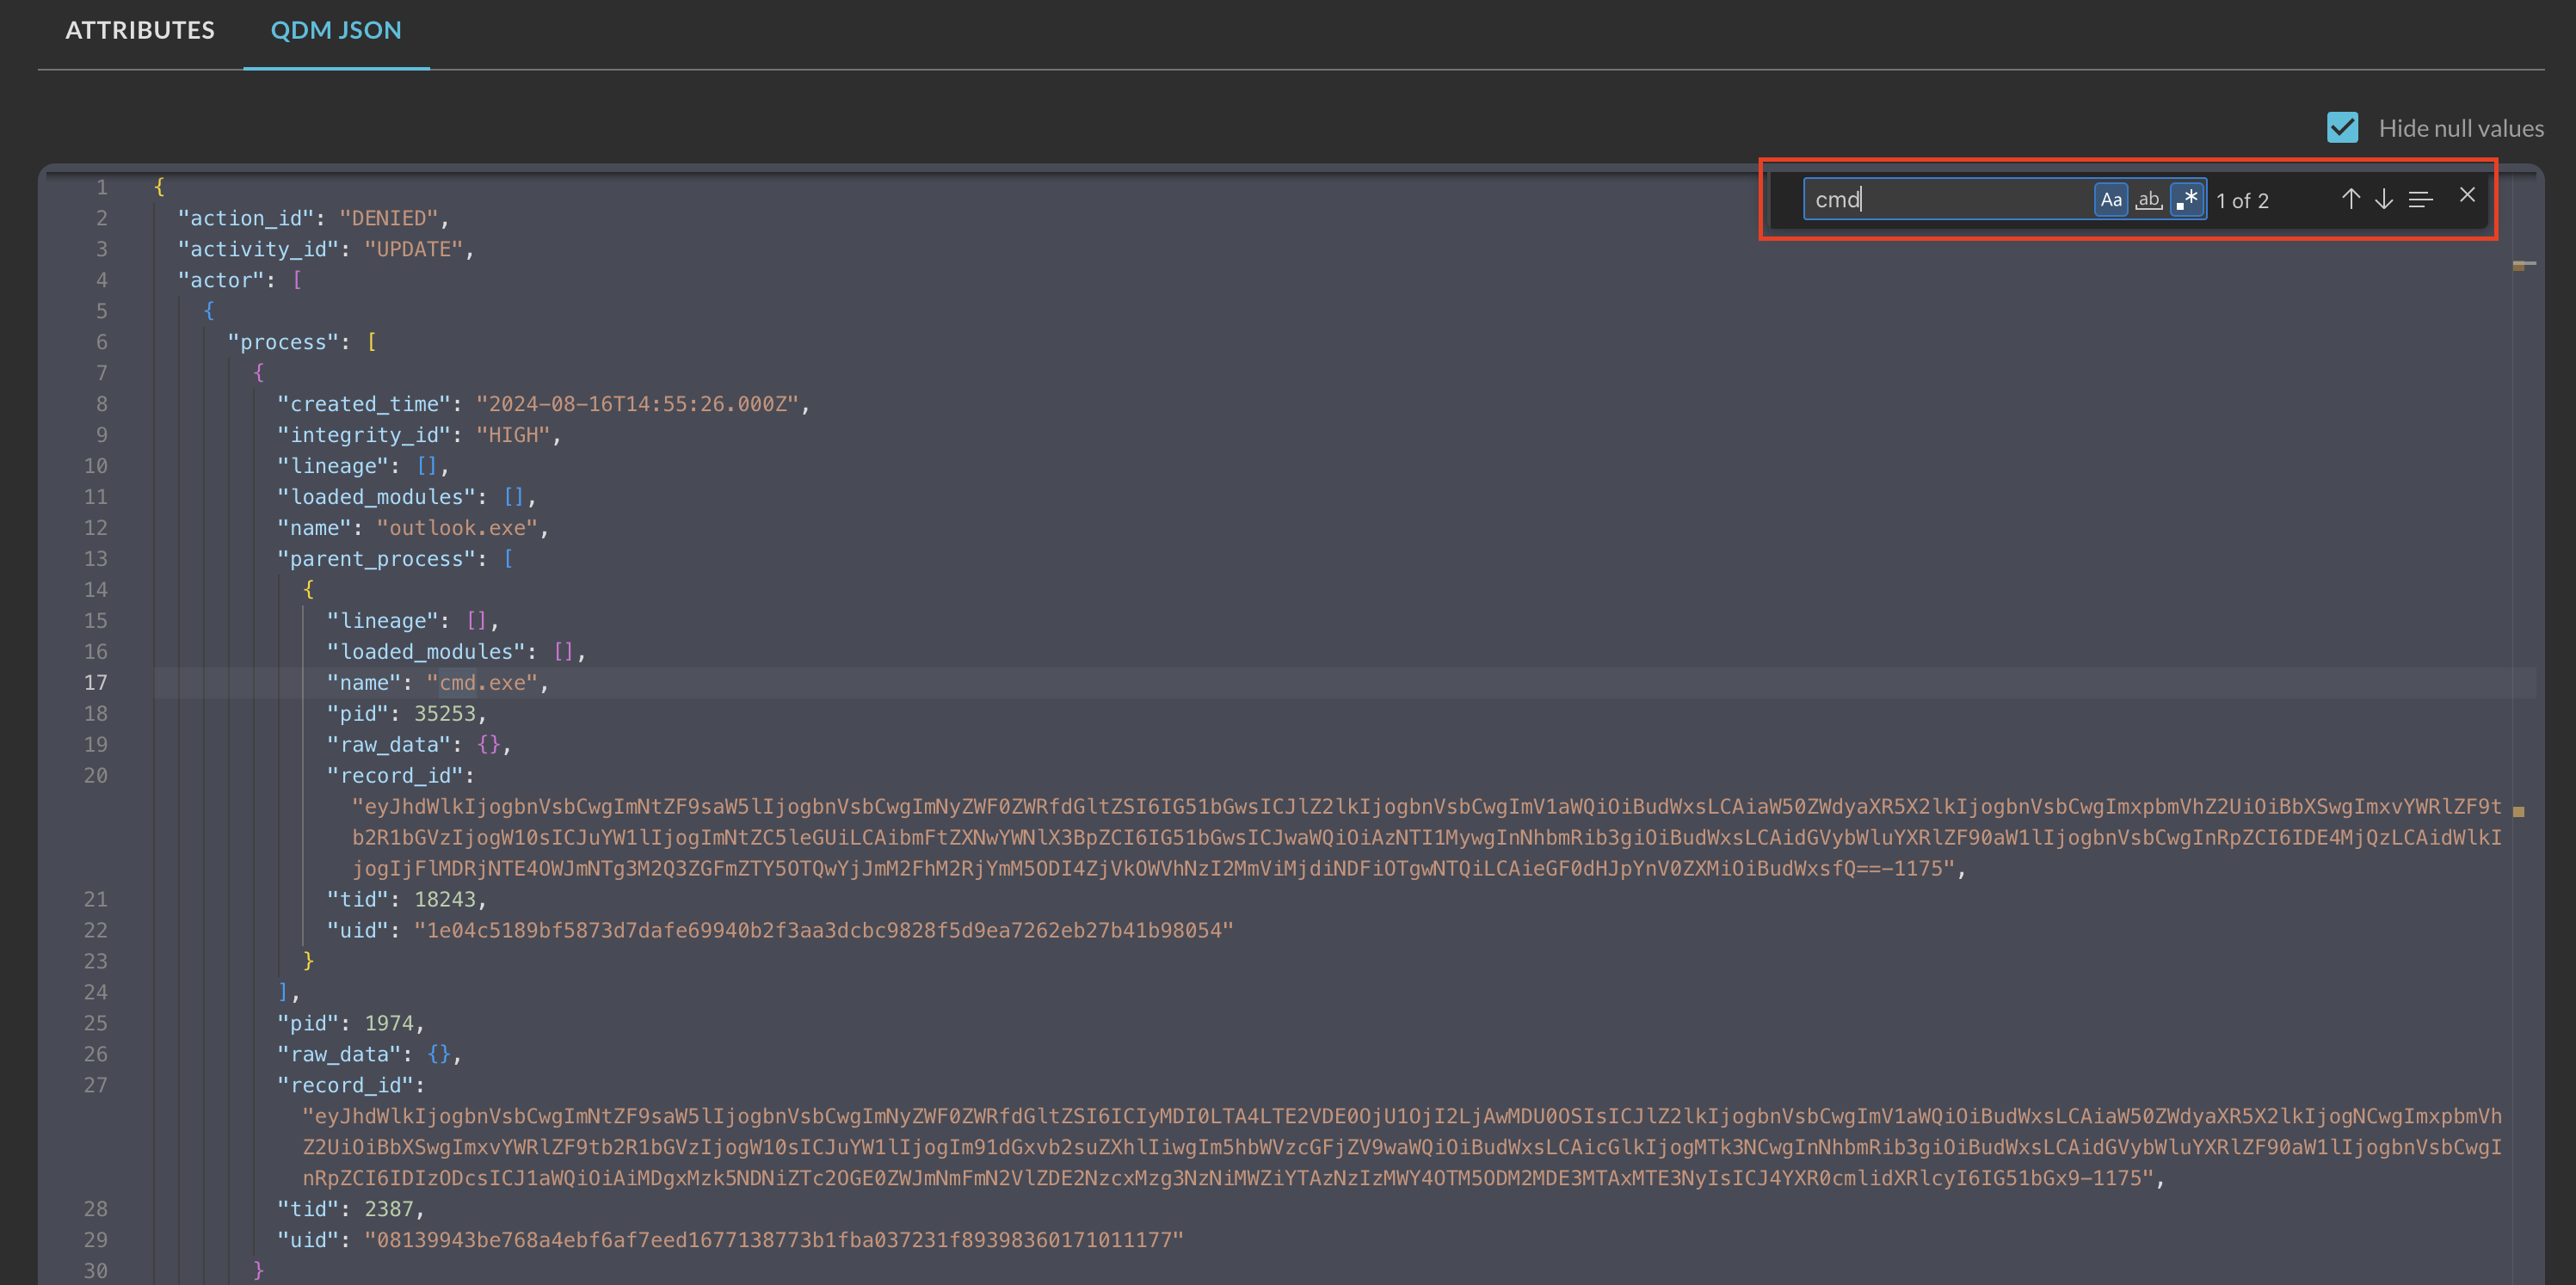
Fig. 19 - Searching with CTRL + F or CMD + F in QDM JSON results
Finally, the last notable feature of the results pane comes from the unmapped Object within the QDM/OCSF schema. Unmapped data is a paradoxically named Object that defines data that doesn't otherwise fit into a normalized attribute within the schema but is important to the context of a given Event or for a specific investigation. This is also known as "custom mapped" data and is controlled by the Query Engineering team for certain static Connectors, such as Microsoft EntraID when showing the Device Inventory Info Events, normalized from the /devices API in the Microsoft Graph.
When any Unmapped data is present within a Connector, the syntax is highlighted in a different color along with an asterisk that provides information about the Unmapped data when hovered over as shown below (Fig. 20).

Fig. 20 - Unmapped data in the results detail pane
As Query adds more features to the new version of results, keep any eye on this page as well as your email and in-app alerts for updates from the team!
Updated 4 months ago