Visualizing Results
Query does the heavy lift of normalizing results into Query Data Model (QDM) and showing them as entities and events. Let's start with the first view, which is the Row View.
Row View
Row view is the default view, with individual search results as rows. You can scroll to the bottom and paginate through results. You can change the sort field or sort order from the menu item on the top right. The fields to sort on are data-driven, dynamically detected from the available results.
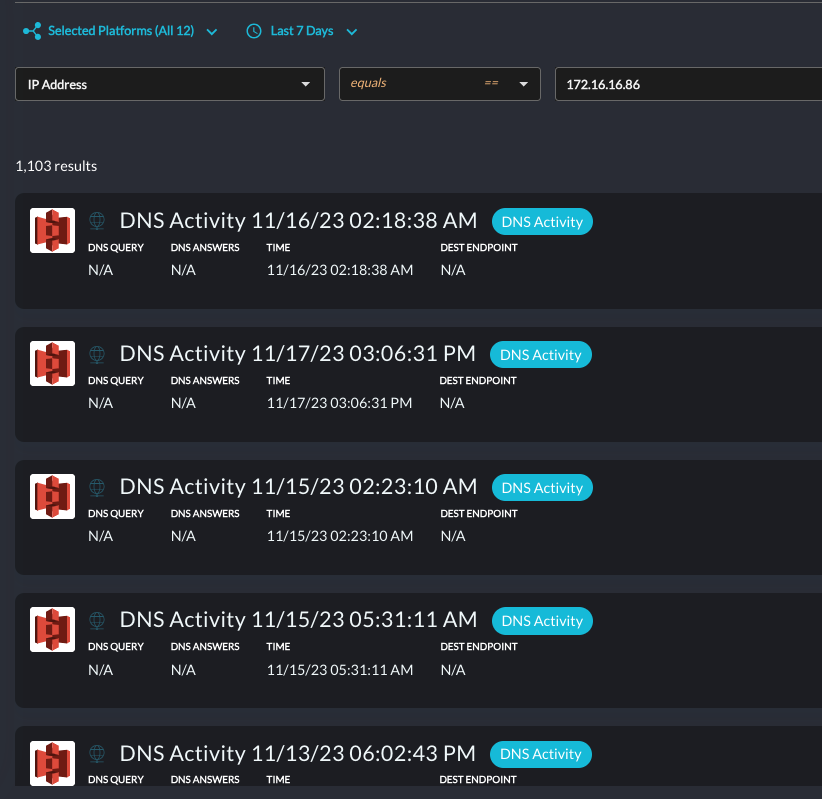
Row View (Click to enlarge)
Note: only a subset of results are transferred from the data sources for visualization. The maximum number of results to transfer is determined by cache settings and default to 1000 results per data source. Operations like sorting are performed on the cached set of results vs on the full source data.
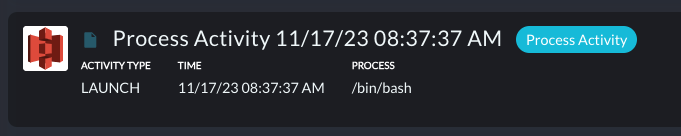
Row Details and Entities
Each row shows some of the key data fields. Also, detected Entities from QDM like User, Device, Endpoint, File, etc. are shown on the right.
Row Detail View
Click on any row to bring the row detail view to show all data for that row. The data shown here consists of these attributes in order:
- Fields that contained entity values
- Other attributes of the object/event
- Raw Data from the platform
- QDM fields-values that were extracted and populated from this result
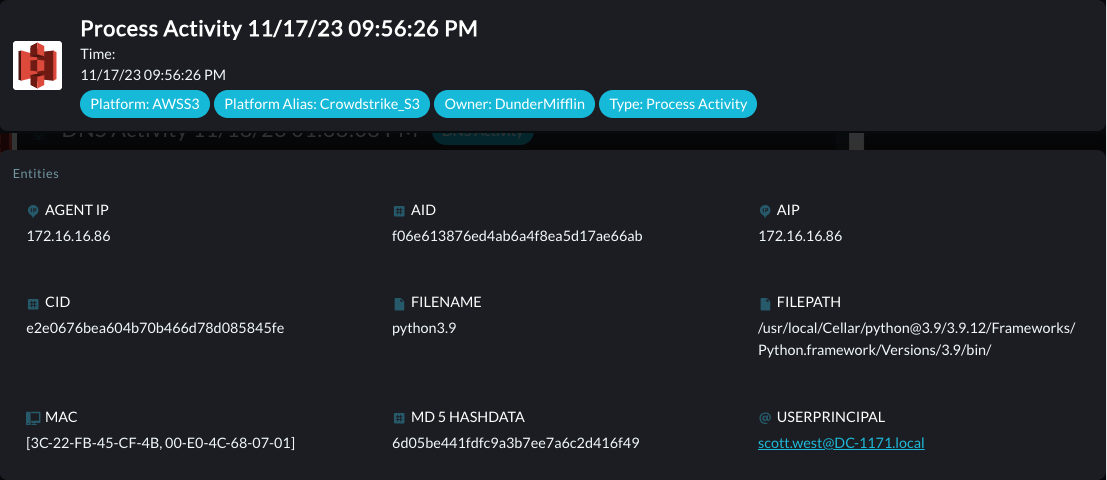
Details of a record
Data Summary View
In the panel to the right of individual results, you will see a Data Summary view that gives faceted information on particular fields. This view will give you an idea of the frequency distribution of any field's values. Clicking on any value will filter the visible results to only show the rows that have that particular field-value.
Note that the facet-counts are from the cached set of results that were pulled, vs from all data.
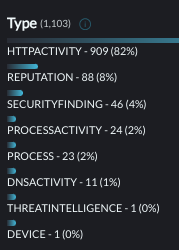
facets
Graph View
Instead of the Row View, you can select the Graph View option from the selector at the top-right. The Graph View will show a summary of relevant Entities and their relationships. By default the nodes are clustered by platform, but you can customize that. Click on the top right Viewbutton to customize the layout, sizing, and clustering options.
Note that the graph nodes and counts are from the subset of search results transferred from the source platform vs the full matched source data.
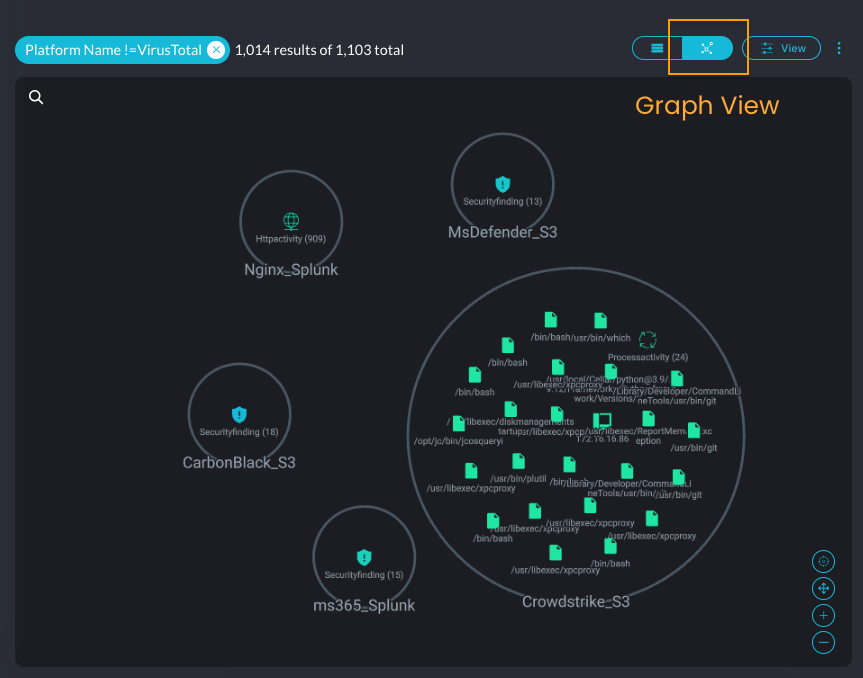
On the bottom right corner of the graph, you will notice additional controls to zoom in/out, pan, and center the graph.
Clicking on any node will bring up additional contextual data. You can see the individual result rows that were aggregated into that node. You can expand any of those results to see its full details.
To back out from the currently selected node, you can click anywhere else on the graph outside of that node.
Updated 12 months ago